Greater London sales & rental review Q4 2020

In terms of sentiment 2020 was a case of London vs. the rest, with stories of buyers keen to move to larger homes in the country now they can, or must, work from home and avoid the commute. But the data so far is not backing this up in the sales market, with values and activity across most of London performing well in Q4.
Data for London is compared to the rest of England in Figure 1. This shows that prices are rising faster in the capital than outside, with the Land Registry reporting annual growth of 9.7% in November compared to the UK’s 7.6%. Transactions in London are still further off their long-run average but closed the gap from -18% at the start of the year to -13% in September.
Figure 1: London vs. rest of England: values, rents and transactions
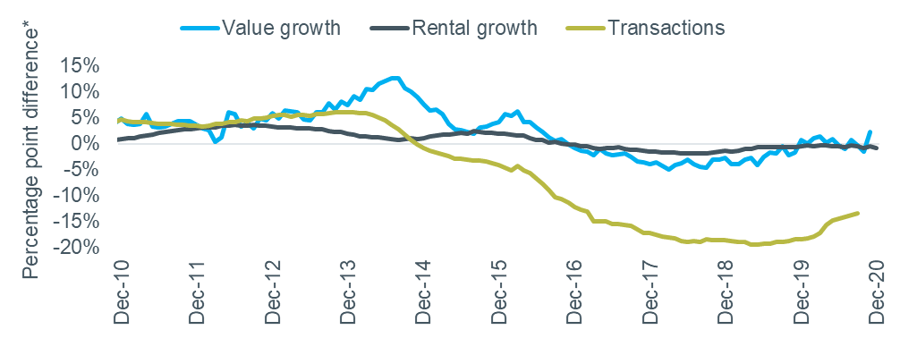
Source: ONS, Land Registry. *Positive = London performing better than rest of England
The London rental market is a different story. The ONS index above shows continuing low levels of underperformance, but it is based on rents paid for existing tenancies so does not respond to changes very quickly. Other indicators suggest that an influx of new supply is putting significant downward pressure on rents.
Rightmove’s Q4 index, based on asking rents, reported a quarterly fall of 1.7% for Greater London, taking the annual change to -6.4%. This drop is driven by the performance of inner London, which fell to an annual change of -12.4%, with an increase in rental stock of 139% compared to a year earlier.
Homelet’s December index showed a similar trend, with rents down 4.5% annually in Greater London, compared to +5.7% in the rest of UK. A summary of the latest data is shown in the table below.
Table 1: Greater London Rental Data, Q4 2020
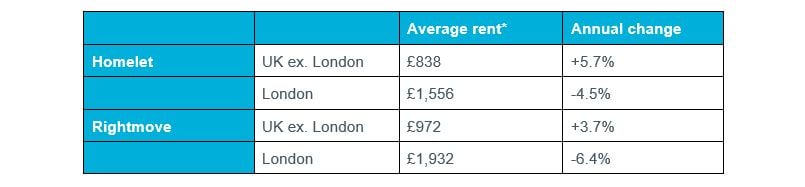
Source: Homelet Index (actual achieved rents), Rightmove Rental Trends Tracker (asking rents)
One explanation for this large divergence between London’s rental market and the rest of the country is the different nature of the workforce in the capital. The city has a high proportion of overseas workers and people born outside the UK are almost three times as likely to live in the PRS, 38% vs. 14%, according to the Labour Force Survey
A significant number of working non-UK born residents appear to have left the city, with a report by ESCoE suggesting that their population has fallen by more than half a million. Some will have gone because their job has been furloughed, some because of Brexit, and some may have returned to their families in a time of uncertainty. The proportion that returns could have a significant impact on future rental demand in London.
Borough Level Data
The table below shows average values by borough for various property types, based on completed sales.
Table 2: London Borough House Prices, to November 2020
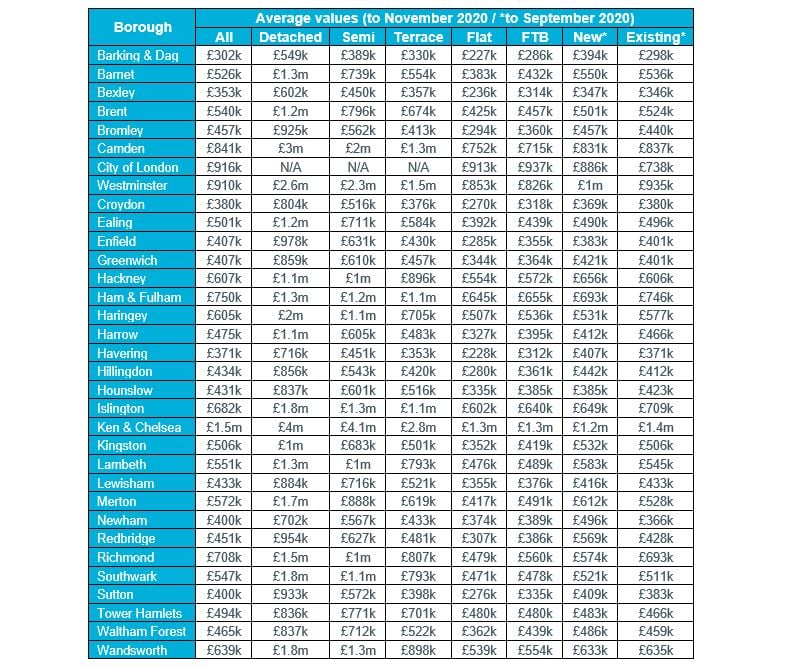
Source: ONS, Land Registry
Note from Land Registry: Low numbers of sales transactions in some boroughs can lead to volatility in the data. While we make efforts to account for this volatility, the change in price in these local levels can be influenced by the type and number of properties sold in any given period.
The table below shows median by borough by size of property, based on all rents paid.
Table 3 – London Borough Rental Values, October 2019 to September 2020
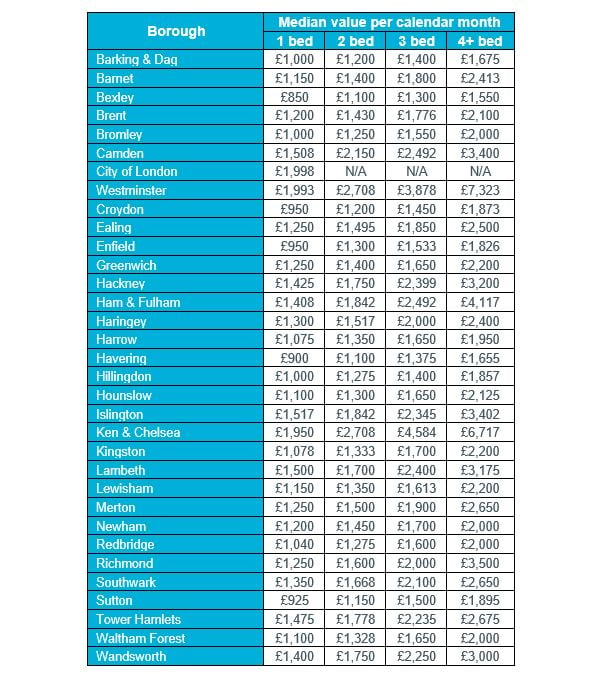
Source: ONS/VOA
