Wider South East Q4 2020

The wider South East saw strong price growth in Q4, in line with the performance of the UK market, according to the Nationwide indices.
Table 1 shows their latest (Q4) index results, with Figure 1 showing the trend data. Annual growth for all three south eastern regions reached their highest levels since late 2016.
Table 1: Regional House Prices Q4 2020

Source: Nationwide House Price Index (values rounded to £1000)
Figure 1: House Price Growth: Wider SE, London and National

Source: Nationwide (Wider SE represented by average of ‘Outer Met’, ‘Outer SE’ and ‘East Anglia’ areas). Note: Quarterly regional series uses different UK figure to main monthly index
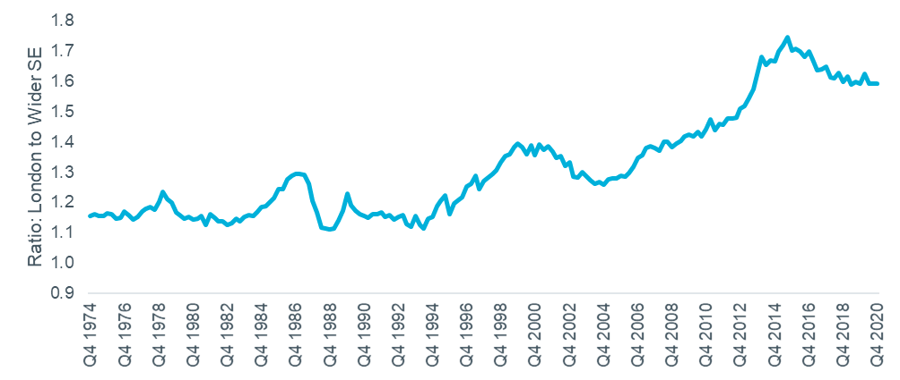
Figure 2 compares the long run data and shows that the fall in the ratio of London values to the wider South East has slowed. The high point of 1.75 was reached in Q4 2015, with the latest figure being 1.59, unchanged from Q4 2019.
Figure 2: Ratio of London to Wider South East values

Source: Nationwide (Wider SE represented by average of ‘Outer Met’, ‘Outer SE’ and ‘East Anglia’ areas).
Some commentators expected values in London to be impacted negatively by the pandemic, with the enforced changes to working and commuting patterns and demands for more space driving a shift out to the suburbs and beyond. So far there is little in the data to suggest this has happened, with the Greater London sales market part of the same ‘mini-boom’ as the rest of the country over the second half of 2020.
Analysis of Rightmove’s 2020 search data does however indicate growing demand for rural property. The largest increases in buyer interest in 2020 compared to 2019 were seen in coastal and rural locations, with the top five shown in the table below. They also reported increased interest in larger homes with outbuildings and home-working spaces.
Table 2: New listings hotspots

Source: Rightmove
Wider South East Rental Market
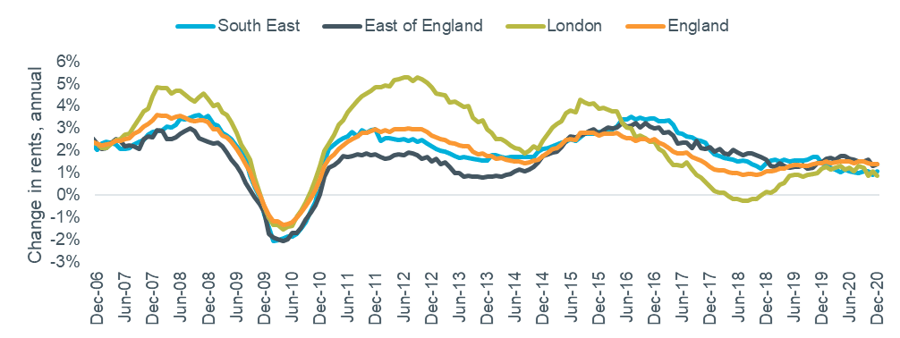
Figure 3 shows rental growth data at regional and national level. This is based on all rents paid so is slow to respond to changes in market conditions. With annual growth around 1% in December, the South East is underperforming the East and the national average (both +1.4%) and is more in line with London.
Figure 3: Rental Growth: Southern regions, London and National

Source: ONS Index of Private Housing Rental Prices
Analysis based on new lettings showed higher levels of growth. A summary of the latest data, from Rightmove’s Q4 index and Homelet’s December index, is shown in the table below. Homelet reported very strong growth in both the East and South East, noting that this was driven by increased demand over the second half of the year.
Table 3: Regional Rental Data, Q4 2020

Source: Homelet Index (actual achieved rents), Rightmove Rental Trends Tracker (asking rents)
