Wider South East Q2 2021

The wider South East is seeing strong house price and rental growth in 2021, outperforming London but broadly in line with national trends.
Within the South East, coastal locations and lower value markets furthest from London tend to have seen the highest price growth.
South East sales market
House price growth accelerated across the wider South East in Q2, with values rising approximately in step with the national average, according to the Nationwide indices. All three South East areas saw stronger growth than London. Table 1 shows the latest regional index results, with Figure 1 showing the data back to 2006.
Table 1 – Regional house prices, Q2 2021
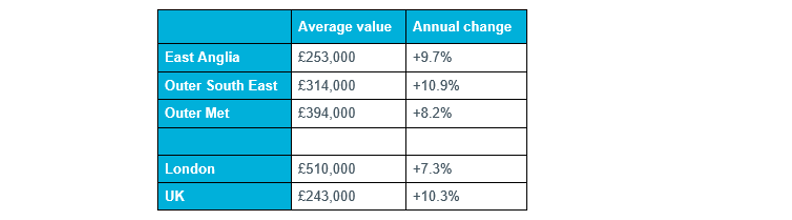
Source: Nationwide House Price Index (values rounded to £1000)
Figure 1 – House Price Growth: Wider South East, London and National

Source: Nationwide (Wider SE represented by average of ‘Outer Met’, ‘Outer SE’ and ‘East Anglia’ areas). Note Quarterly regional series uses different UK figure to main monthly index.
Despite the above growth figures, there was a slight rise in the ratio of London values to the wider South East in Q2 (due to higher prices in the capital). However, in general the recent trend has seen this ratio fall since it peaked in Q4 2015 at 1.75, as shown in Figure 2. The latest figure is 1.59, compared to 1.57 in Q1.
Figure 2 – Ratio of London to Wider South East values
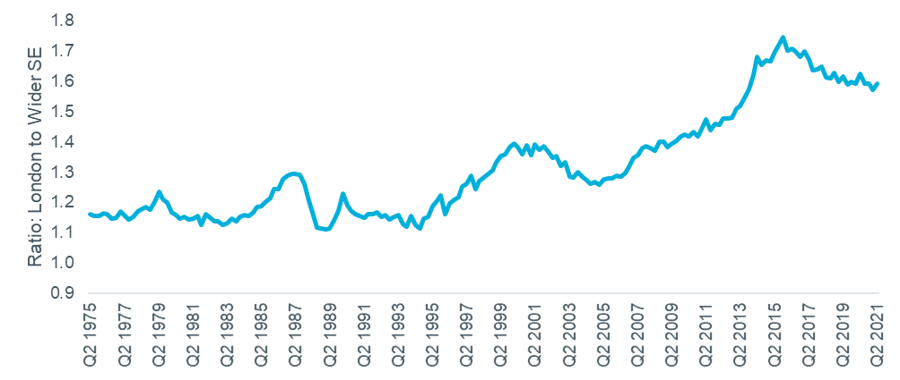
Source: Nationwide. (Wider SE represented by average of ‘Outer Met’, ‘Outer SE’ and ‘East Anglia’ areas)
Looking more locally, house price growth is not evenly distributed across the wider South East. The highest rates of annual growth – over 10%, based on Land Registry data up to May 2021 – are seen in locations including Thanet, King’s Lynn and West Norfolk, Hastings, and the Isle of Wight. These are all on the coast outside what would usually be considered the commuter belt, with average values 20 to 30% below their respective regional averages.
Figure 3 – Annual house price growth at local authority level, May 2021

Source: Land Registry, 6-month smoothed data
South East rental market
Figure 4 shows rental growth data at regional and national level from the ONS. This is based on all rents paid so is slow to respond to changes in market conditions. Rents in the East are growing the fastest on this measure, with annual growth of 1.7% in June, with the South East at 1.3% also ahead of the national average (1.1%). By contrast, rents in London fell by 0.1%.
Figure 4 – Rental growth: Southern regions, London and National
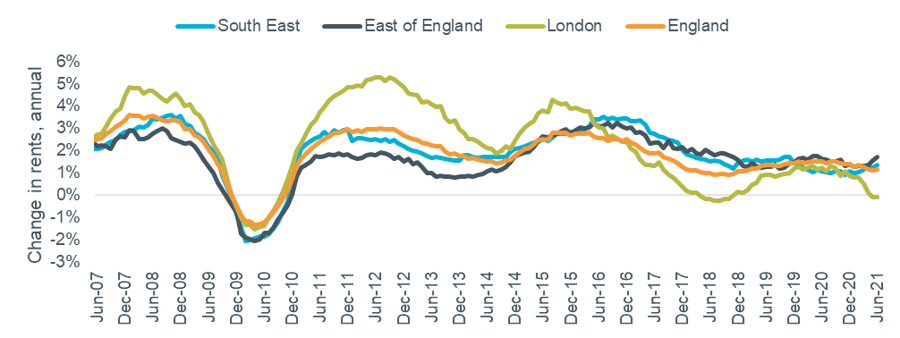
Source: ONS Index of Private Housing Rental Prices
Analysis based on new lettings showed higher levels of growth. A summary of the latest data, from Rightmove’s Q2 index and Homelet’s June index, is shown in the table below. Annual rental growth is approaching double-digits according to Homelet in both the East and South East, driven by a lack of stock as some landlords took advantage of the strong sales market to exit the sector.
Table 2 – Regional rental data, Q2 2021

Source: Homelet Index (actual achieved rents), Rightmove Rental Trends Tracker (asking rents)
Rightmove’s index also recorded relatively high levels of growth in both regions, with additional analysis on rental ‘hotspots’ highlighting the top 10 areas for rental growth across the country. Five of these were in the South East, shown in the table below.
Table 3 – Rightmove Rental Hotspots

Source: Rightmove