UK rental review Q3 2021
The rental market recovery strengthened further in Q3, with high demand and low supply conditions continuing across the country.
This recovery now includes flats in urban areas, including London, with the return of city life driving additional demand.
National data
The rental market picture in Q3 was largely unchanged from Q2, with agents reporting high demand and low levels of new instructions and therefore expecting rents to continue increasing, according to the September RICS Survey. The net balance for ‘Tenant Demand’ reached +62 (vs. +60 in June); ‘Landlord Instructions’ remained low after a small rise to -21 (June -32); and ‘Rent Expectations’ also stayed high at +55 (June +46). Figure 1 shows these metrics along with the ONS rental index, which recorded a slight increase in growth to 1.3% in September, compared to 1.2% in June. This measures all rents paid rather than new lettings, so continues to underestimate rental value growth among new listings.
Figure 1 – rental growth vs RICS rental indicators
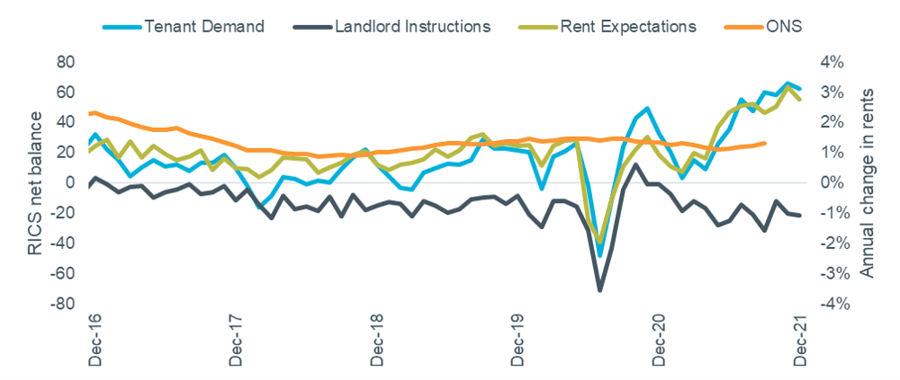
Source: RICS Housing Market Survey (Sep 2021), ONS IPHRP (GB). Note RICS data lagged 3 months.
Rightmove’s Rental Price Tracker reported annual rental growth for the UK (excluding London) of 8.6% in Q3. The recovery in city centre rental demand highlighted last quarter accelerated in Q3, with double-digit growth in locations including Bristol, Nottingham and Birmingham contributing to the strong overall performance. Homelet recorded a similar annual growth figure of 7.6% for the UK excluding London in their September index.
Regional data
A summary of the latest regional rental data is shown in the table below.
Table 1 – Regional rental data
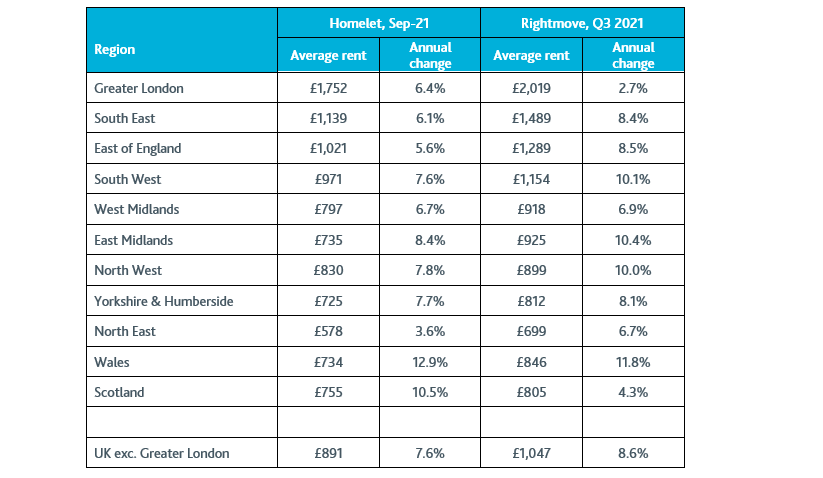
Source: Homelet Index (actual achieved rents), Rightmove Rental Trends Tracker (asking rents).
Arrears and possessions
The proportion of private renters in arrears has increased through the pandemic, according to the Household Resilience Study (part of the English Housing Survey). The latest data, from April-May 2021, showed 7% of tenants in arrears, compared to 3% pre-pandemic (measured by the 2019-20 English Housing Survey).
Figure 2 – proportion of private renters in arrears
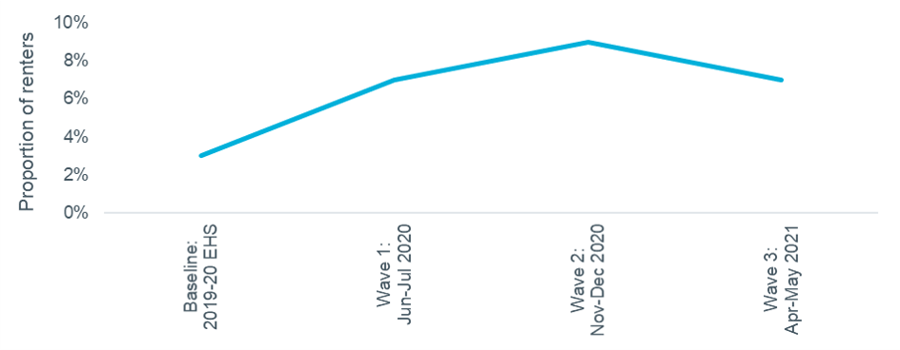
Source: Household Resilience Study Wave 3 April-May 2021
The eviction ban ended in May, in the middle of the latest quarter for which data is available. Landlord possession activity remains well below usual levels, as shown in Figure 3. 7,000 claims were issued in Q2, around 21% of the usual level (2015-19 average). Repossessions increased to 1,500 but this is only 17% of typical activity.
Figure 3 – landlord possessions, quarterly
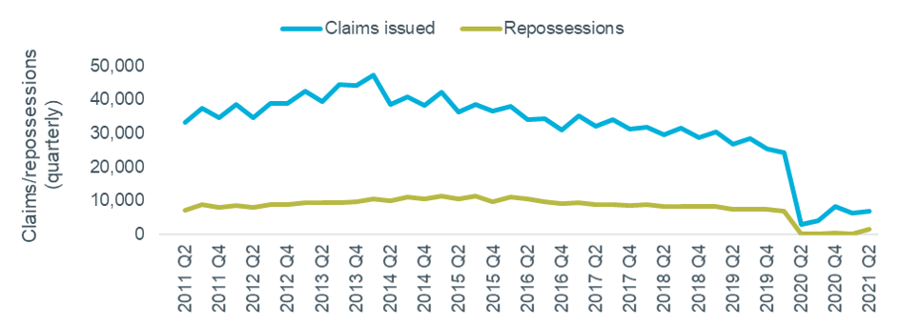
Source: HMCTS