UK development review Q3 2021

More of the same for the development statistics in Q3 as pre-pandemic levels of output continue both at national and London level.
However, a major shift on the direction of planning reforms was signalled by the Prime Minister, with a strong focus on brownfield land. This could potentially impact negatively on future levels of supply.
National overview
Weekly energy performance certificates for new homes, as shown in Figure 1, are an up-to-date indicator of housebuilding. The chart highlights how new build output in 2021 remains very much in line with where it was in 2019 and 2020, excluding the period in Q2 2020 when sites were closed. There is still no sign of the industry delivery additional homes to make up for this ‘lost’ output.
Figure 1 – EPCs for new build, England, weekly

Source: DLUHC
Figure 2 shows new build activity (again represented by EPC data) plotted against total transactions, both indexed to the end of 2019. Both fell by around 15% due to 2020’s lockdowns but, while overall transactions now sit over 30% higher than they were pre-pandemic, the supply of new homes is unchanged.
Figure 2 – total transactions vs. new supply

Source: DLUHC, HMRC
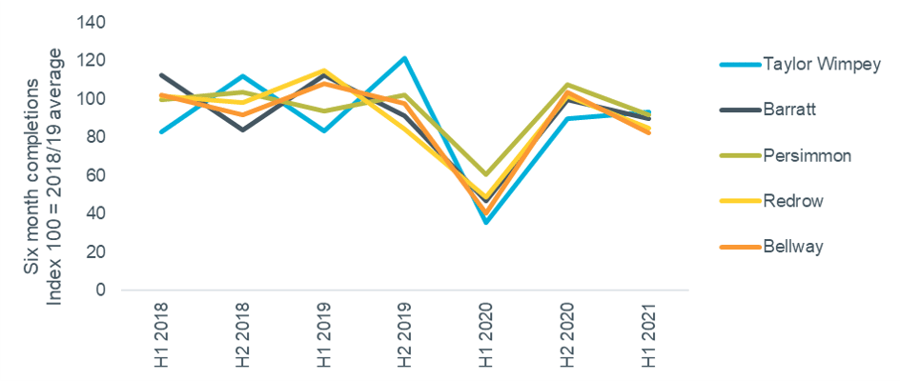
Figure 3 shows how new homes delivery by the major housebuilders has been affected by the pandemic. Output was relatively steady through 2018 and 19 but fell by at least 40% in the first half of 2020. Since then, it has regained most of the lost ground but the number of completions for each of the five companies remained slightly below their pre-pandemic level. The reasons for this muted pace of recovery include a pandemic-driven change in demand, with buyers increasingly looking for larger homes, plus labour and material shortages.
Figure 3 – large housebuilder output
Source: Company Accounts & Updates
Planning update
September saw a change in the Secretary of State responsible for planning, with Michael Gove replacing Robert Jenrick. It also saw MHCLG rebranded as DLUHC, the Department for Levelling Up, Housing and Communities.
The Prime Minister’s party conference speech marked a more important change, with a major shift in rhetoric on planning signalling a return to the ‘brownfield first’ policy of the late 1990s. This was interpreted by some in the sector as potentially even going beyond brownfield first, to brownfield only. The change is a reaction to the unpopularity of the previously proposed planning reforms within the Conservative party.
While there has not yet been a formal change in policy, the impact of this change could be very significant for housing supply, in terms of overall numbers as well as mix and locations. Existing Brownfield Registers and Strategic Housing Land Availability Assessments indicate that there is insufficient capacity on brownfield land to meet housing need.
Much of what does exist is in urban areas and would be best suited to dense, flat-based developments, potentially in conflict with a market where occupier demand has shifted towards houses in more rural locations – although it is unclear if this pandemic-driven trend will continue in the longer-term.
London development
Q3 saw new build sales and starts accelerating in London, according to the latest Molior data shown in the table below. Although all three metrics are slightly down on Q3 2020, this is mainly due to the stronger performance as the market reopened after lockdown last year.
Private sales and Build to Rent activity both played a part in this strong performance, although the latter was the largest market segment this quarter, as it has been for five of the previous six quarters. Molior’s October report noted that a wide range of buyer types are in the market: first time buyers via Help to Buy, downsizers, and international buyers. They also highlighted significant numbers of housing association homes being switched from private to affordable, showing the range of exit strategies for developers.
Table 1 – London development data, Q3 2021
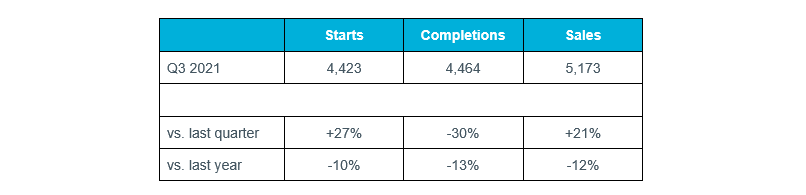
Source: Molior
The annual time series data is shown below in Figure 4, with starts and sales down on this basis, mainly due to Q1 2021 being a poor quarter. Overall, around 55,000 units are currently under construction across the capital, in line with last quarter and 10% down compared to the start of the year.
Figure 4 – quarterly development trends, London
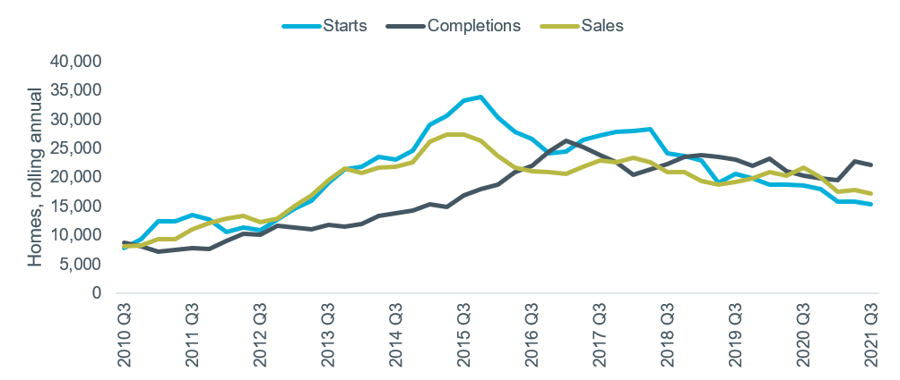
Source: Molior
Energy Performance Certificates for new dwellings are another measure of completions, with the latest data shown in weekly form in Figure 1. Although there is significant volatility week-to-week, the average trend for 2021 continues to be around 800 completions per week, in line with 2019 and the parts of 2020 where sites remained open.
Figure 5 – EPCs for new build, London, weekly

Source: DLUHC.