UK economic outlook Q2 2021
The recovery continues but the economy remains smaller than before the pandemic and a range of risks persist.
Consumer and business sentiment are improving, and unemployment is low, but the true test will come as Government financial support is withdrawn.
GDP and outlook
The economy continued its gradual recovery to pre-pandemic levels in Q2 as the lockdown restrictions were lifted in phases. GDP grew by 2.0% in April and 0.8% in May, but remains around 3% below where it ended 2019 – the trend of monthly estimates are shown in Figure 1. Note that due to the challenges faced in estimating GDP in the current conditions, the ONS warning on uncertainty remains in place so these results are subject to change in future releases.
Figure 1 – Monthly GDP estimates
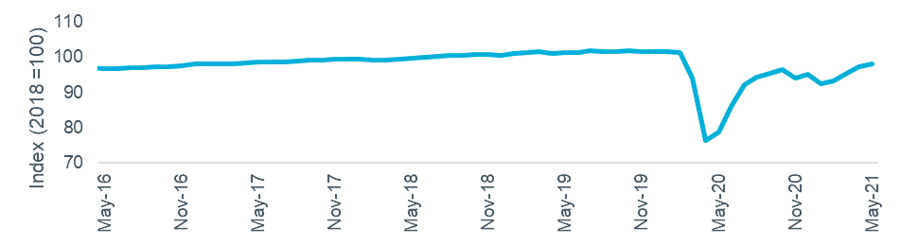
Source: ONS
Confidence in the economy continued to be mixed, based on the sentiment indicators shown in Figure 2. Consumer and business optimism both grew in Q2, with the services PMI metric moving significantly into positive territory. However, the latest data on savings (for Q1) showed households increasing their savings again, perhaps indicating growing uncertainty around future incomes.
Figure 2 – Other economic indicators
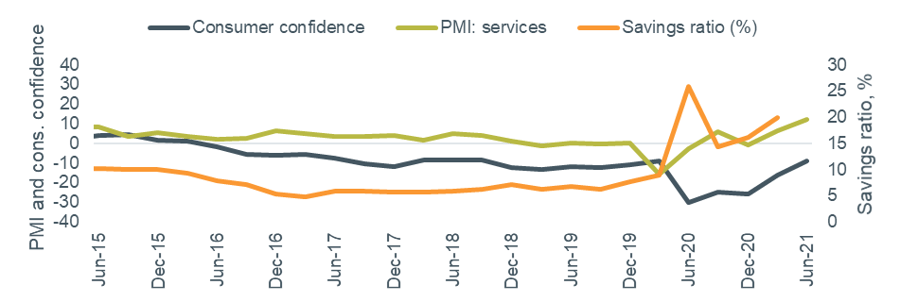
Source: GfK/NOP, IHS/Markit, ONS
The changing outlook for economic growth is reflected in the range of external forecasts collected in the Treasury’s Forecast Comparison reports. The most recent data is shown in Figure 3. This suggests a degree of consensus among the contributing economists, with a narrow range of views, and is more positive than earlier in the year. The official central economic scenario from the OBR remains an expectation of +4.0% GDP growth produced in March.
Figure 3 – 2021 UK GDP forecasts over time
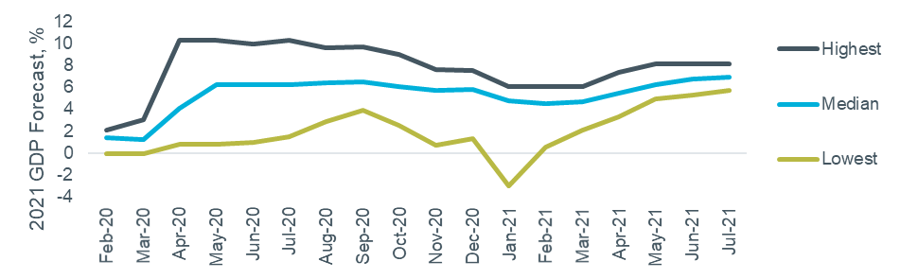
Source: HM Treasury (Month = date of report, data is the range of forecasts made in last three months)
Employment
The three months to May saw another small fall in unemployment, from 4.9% to 4.8%. On an annual basis the alternative employment indicators – shown in Figure 4 – look very positive, but these are affected by base effects from the first lockdown in Q2 last year.
Figure 4 – Economic indicators: Hours worked, paid employees and median pay
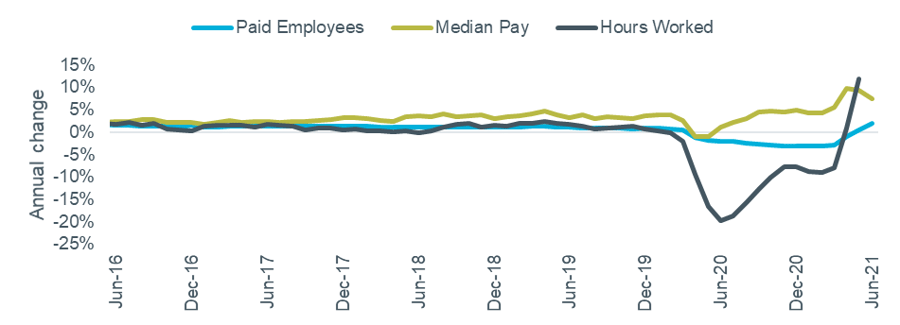
Source: ONS Labour Force Survey and HMRC PAYE Real Time Information
Paid employees and hours worked are showing significant annual growth, but the table below highlights the difference in these measures compared to pre-pandemic trends. By contrast, median pay has risen throughout the pandemic, but this is in large part due many lower paid roles being lost or furloughed rather than genuine pay growth on a like-for-like basis.
Table 1 – Employment data
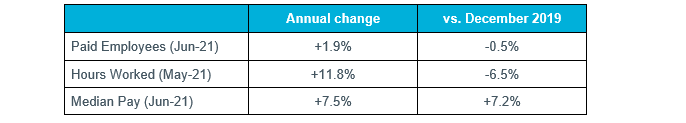
Source: ONS, HMRC
Use of furlough (the Coronavirus Job Retention Scheme) fell in Q2 as more of the economy was allowed to open again, with 2.4m employments estimated to be on hold at the end of May. This is approximately half of the 4.7m jobs furloughed three months earlier and compares to a peak of 8.9m in May 2020. A summary of the data is shown in Figure 5.
Figure 5 – Coronavirus Job Retention Scheme data
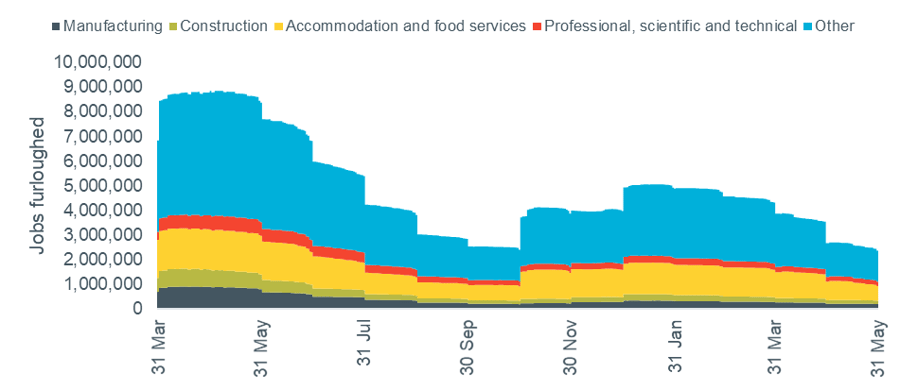
Source: HMRC
Tourism-related industries continue to be the biggest users of the scheme: 57% of jobs in passenger air transport, 57% in hotels and similar accommodation, and 51% in travel agency and tour operator activities were furloughed at the end of May.
Banks and lending
Lenders reported an active mortgage market in Q2, according to the latest Bank of England Credit Conditions Survey, of which a selection of results are shown in Figure 6.
Figure 6 – Secured lending availability and demand
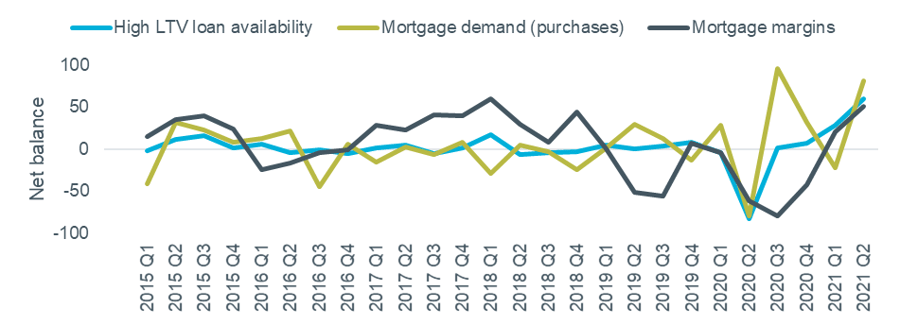
Source: Bank of England Q2 2021 Credit Conditions Survey. Note Negative net balance = decreasing availability / decreasing demand / wider margins.
Availability of high LTV products grew by the fastest rate on record (the data series started in 2008), demand for mortgaged purchases increased significantly, and mortgage margins fell.