London sales & rental review Q1 2022

Source: ONS, Land Registry. *Positive = London performing better than rest of England
Homelet’s March index, based on newly agreed lets, again recorded very strong rental growth in London. Annual growth reached 11.6%, compared to a UK excluding London figure of 6.6%. London also recorded higher growth compared to the national average in Rightmove’s Q1 index (14.3% vs. 10.8%), with both figures reaching very high rates.
Table 1 – Greater London rental data
| Average rent pcm | Annual change | ||
|---|---|---|---|
| Homelet, Mar-22 | UK ex. London | £893 | +6.6% |
| London | £1,770 | +11.6% | |
| Rightmove, Q1 22 | UK ex. London | £1,088 | +10.8% |
| London | £2,193 | +14.3% |
Market sentiment
Sentiment in the capital remained positive in Q1, with the March RICS survey (results shown in Figure 2) reporting expectations for growth in prices and activity both in the short and longer-term. Three-month expectations for prices had a net balance of +38 in March, while the 12-month measure was +69. Sales volumes are also set to continue increasing, with the short and long-term figures at +48 and +55 respectively.
Figure 2 – RICS Survey Sales and Price Expectations, London


Source: RICS Housing Market Survey (Mar 2022)
The dynamic of supply well ahead of demand in the London rental market also continued in Q1. The net balance for tenant demand increased to +60 in March, although new instructions did edge into positive territory at +5. Rent expectations hit another record high of +80.
Figure 3 – RICS Survey Rental Indicators, London
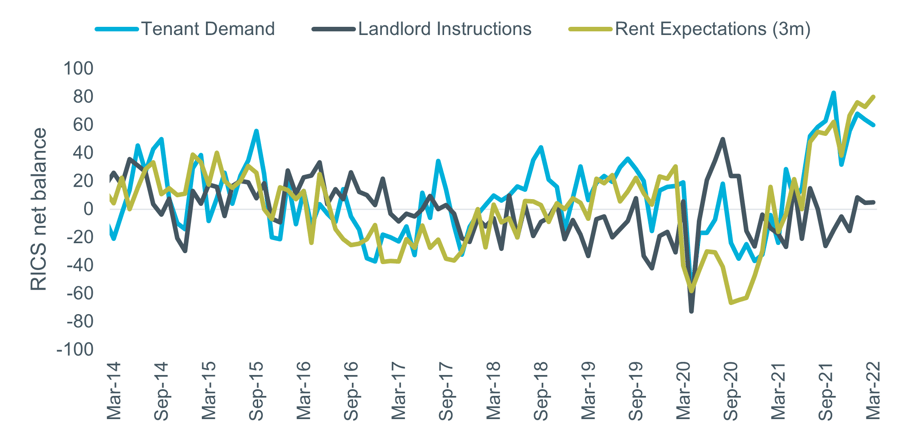
Source: RICS Housing Market Survey (Mar 2022)
Prime Central London
Sales values were unchanged in Q1 with a slight increase in rents, according to the Cluttons Prime Central London Index, the recent results of which are shown in Figure 4. On an annual basis sales values are broadly unchanged at 0.2% higher than Q1 2021. Rents have been relatively stable for three quarters but are up 17.2% compared to a year earlier.
Figure 4 – Cluttons Prime Central London Index
