UK economic outlook Q1 2022

The economic recovery stuttered in Q1 due to another Covid variant, although many measures are back to their pre-pandemic levels.
Further inflation rises and a developing cost of living crisis are the risks over the rest of 2022.
GDP and output
As expected, economic growth over the past three months stuttered slightly due to the impact of the Omicron variant over the Christmas and New Year period – GDP fell by 0.2% in December. Consumer-facing services remain around 5% below their pre-pandemic level whereas other services are 4% above. Recent GDP growth trends are shown in Figure 1.
Figure 1 – Monthly GDP estimates

Source: ONS
Inflation continued to rise in Q1, with CPI reaching 7.0% in March – the highest figure since March 1992. There are also further upward pressures in the form of energy price rises from April and the war in Ukraine contributing to higher food prices, meaning issues with the cost of living are likely to get worse before they get better. The Bank of England increased the base rate again in March and May, to 1.0%, in response to inflation well above their 2% target level. However, the latest Monetary Policy Committee meeting minutes noted that they expect CPI to reach 9% in Q2 and potentially beyond that later in 2022.
Figure 2 – Inflation (CPI)

Source: ONS
The divergence between business and consumer confidence grew in Q1 – with services PMI hitting the second-highest level for 25 years but consumer confidence falling even below where it was at the height of the pandemic. Figure 3 shows the latest data.
Figure 3 – Other economic indicators
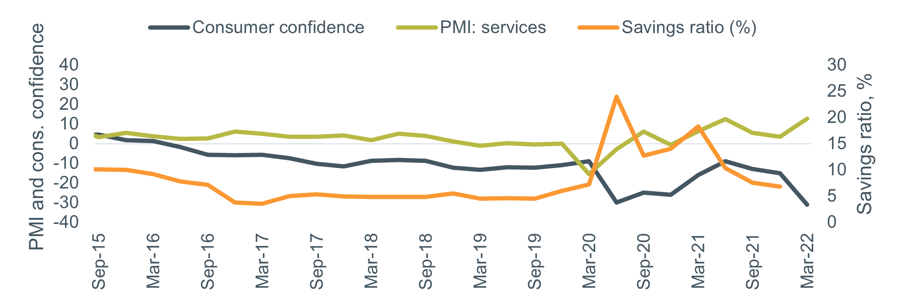
Source: GfK/NOP, IHS/Markit, ONS
The latest consensus among economic forecasters resulted in a small downgrade in expectations for 2022 UK GDP compared to last quarter, according to the Treasury Forecast Comparison reports (time series data shown in Figure 4). The official central economic scenario from the OBR was updated in March, with growth of 3.8% now expected (down from 6.0% back in October).
Figure 4 – 2022 UK GDP forecasts over time
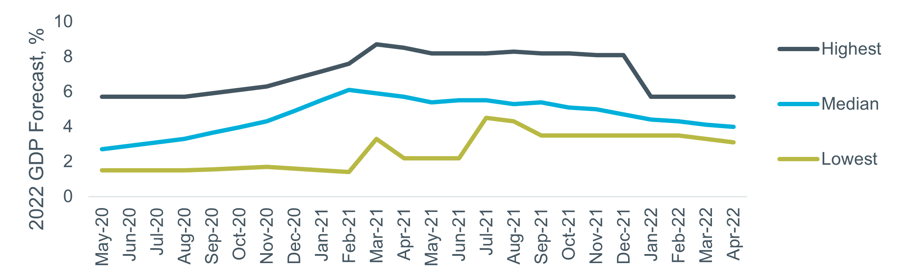
Source: HM Treasury (Month = date of report, data is the range of forecasts made in last three months).
Employment
Unemployment returned to its December 2019 level of 3.8% in the three months to February (compared to 4.1% three months earlier). The latest data for the additional employment indicators, as shown in Figure 5, indicated high levels of growth, continuing the recent trends. In March there were over 540,000 more paid employees now in work compared to the pre-pandemic peak in February 2020, although this continues to be offset by lower numbers of self-employed workers.
Figure 5 – Economic indicators: Hours worked, paid employees and median pay

Banks and lending
Demand for mortgages grew slightly in Q1 after two quarters of falls, with availability of high-LTV products also improving slightly, according to the latest Bank of England Credit Conditions Survey, of which a selection of results are shown in Figure 6.
Figure 6 – Secured lending availability and demand

Source: Bank of England Q1 2022 Credit Conditions Survey. Note: Negative net balance = decreasing availability / decreasing demand / wider margins.