UK sales market Q4 2021

Q4 was the first quarter for over a year with no stamp duty discount available, but the sales market maintained momentum and finished the year with double-digit price growth.
Transactions have so far avoided the steep drop off expected in some quarters, despite shortages of stock for sale.
Early indicators suggest that demand continues to be well ahead of typical levels, and that more supply is likely to hit the market in the first part of the year. This more balanced market, plus risks around inflation, interest rates and cost of living, are likely to see price growth slow in 2022.
Monthly data
There were 67,000 mortgage approvals for purchase in November, which is a return to the average level of activity in the two years to March 2020 (i.e. pre-pandemic). Prices continued to rise in Q4, with the Nationwide index recording monthly growth of 0.7, 0.9 and 1.0% in the final three months of 2021. Longer-term trends for both series are shown in Figure 1.
Figure 1 – UK house prices and mortgage approvals, monthly
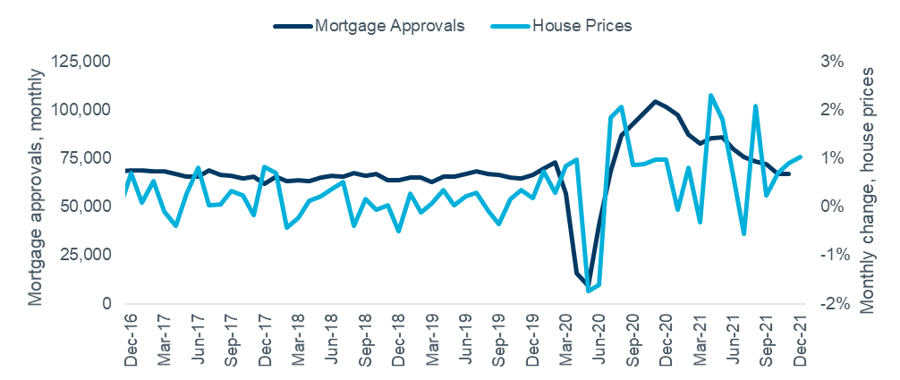
Source: Nationwide HPI, Bank of England Note both seasonally adjusted.
Transaction trends
Q4 was the first quarter for over a year with no stamp duty discount available, but the level of sales did not drop as steeply as expected in some quarters. While activity dipped compared to Q2 or Q3, it held up relatively well compared to typical pre-pandemic transaction volumes. HMRC reported 100,000 sales in December, taking the annual total to 1.49m. This is 25% above the average number of sales in the three years to March 2020.
The ONS also reported continuing high levels of activity, despite their lag in reporting completions. The UK house price index reported over a million transactions in the 12 months to September, but the latest months are likely to be revised upwards.
The RICS Survey results suggest that activity may be settling down after many months of volatility. Agents reported ‘Agreed Sales’ were falling slightly, from -12 in September to -13 in December. Looking ahead, the latest ‘Sales Expectations’ figure of +14 indicates that agents are not expecting an imminent drop off in activity. Figure 2 shows the two survey metrics plotted against the two measures of actual transaction levels.
In the past these results, when ‘lagged’ by nine months, have been a good predictor of short-term trends in activity. Through the pandemic the market has been volatile and responding more quickly, but there are signs it is settling back into previous trends.
Figure 2 – Actual transaction levels vs. RICS sales metrics
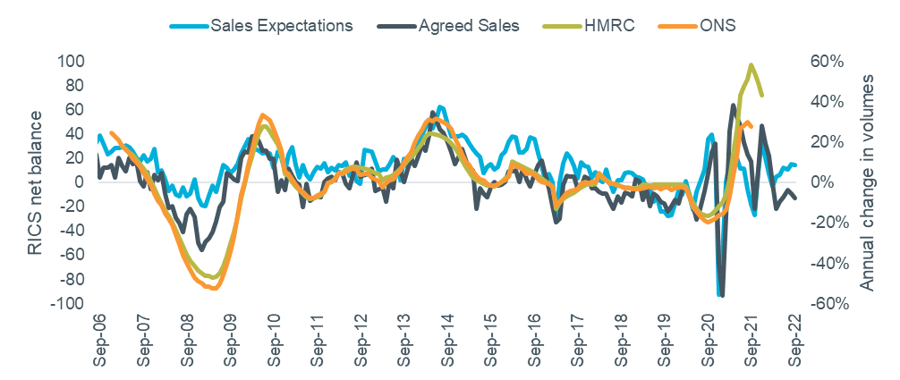
Source: RICS Housing Market Survey (Dec 2021), HMRC, ONS UK HPI. Note RICS figures lagged 9 months. RICS and HMRC figures seasonally adjusted.
Other indicators also suggest that activity has eased slightly rather than dropping more significantly. In their December index Rightmove reported that average time to sell increased slightly to 39 days (37 in September) and noted that a lack of stock rather than a lack of demand was hindering sales – average stock per agent fell to 42 (September = 49). However, vendor valuation requests through the site – the first step to potentially selling a home – were at their highest ever level in the first week of the year, suggesting more stock could be coming to market in Q1.
Zoopla reported that sales agreed were tracking their usual levels for the time of year, despite available stock being 44% down on the five-year average, according to their December index report. They also noted a pick-up in valuation leads, indicating that the supply of homes for sale could improve in the early part of 2022.
House prices
UK house prices grew by 10.4% for the full year according to the Nationwide December index, with the latest ONS index data for November suggesting a similar trajectory (+10.0%). The index results are shown in Figure 3, alongside RICS sentiment survey results.
The net balance for ‘Achieved Prices’ continued at a very high level (+69) in December, marking 16 consecutive months at +50 or above. Looking ahead, ‘Price Expectations’ remained positive at +22, in line with levels over the past six months.
Figure 3 – Actual value changes vs. RICS price indicators
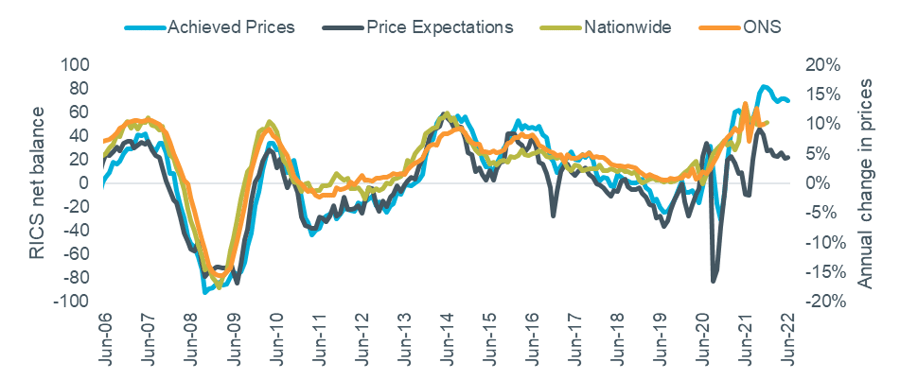
Source: RICS Housing Market Survey (Dec 2021), Nationwide HPI, ONS UK HPI. Note RICS data lagged 6 months.
Annual growth in asking prices reached a five year high of 7.6% according to Rightmove’s December index, taking the average to over £341,000. Their report noted that this was driven by demand remaining high and the number of homes available for sale continuing to be very low.
Growth of 7.4% for 2021 was recorded in Zoopla’s December index, driven by continuing strong demand for houses and increasing demand for flats. Their latest market indicators, shown in the table below, indicate the ongoing imbalance between supply and demand. Zoopla expect growth to moderate throughout 2022 as wider economic pressures impact on demand, forecasting growth of 3% by the end of the year.
Table 1 – Zoopla Market Metrics, 28 days to 16th Jan vs same period in 2018-21

Source: Zoopla December Index
Outlook
Last quarter this note highlighted the potential negative impact of higher inflation and interest rates on the housing market. The Bank of England did raise rates in December and inflation hit a 30 year high, but the housing market appears to have shrugged this off, much as it did with the economic issues of the pandemic.
However, double digit price growth is unlikely to be sustainable, so the question is just whether there will be a hard or soft landing for values. With many homeowners on fixed-rate mortgages and recent buyers stress-tested on their affordability, the conditions for large volumes of forced or distressed sales do not appear to exist. Any significant rise in interest rates is therefore more likely to lead to transactions falling back than a major price correction.