London sales & rental review Q3 2021

The London rental market was very strong in Q3, across both the prime and mainstream sectors, as demand increased significantly due to returning office workers and the usual seasonal boost from students and graduates.
The sales market saw moderate price growth and levels of activity but continued to trail the very strong performance seen in other regions. In Prime Central London (PCL) the sales market remains hampered by limited stock and a gap in price expectations between vendors and buyers.
Greater London overview
House price growth in London reduced the gap to the rest of the country in Q3, with an annual rate of 7.5% only trailing the average for the rest of England by 2.7 percentage points, according to the August ONS index. This is the smallest difference in the year to data, and it had been as high as 9 percentage points in June. By contrast the Nationwide index for Q3 saw the growth rate in London slow to 4.2%, trailing all other regions (UK was 10.3% on this measure).
The relative performance of London and rest of England house price growth is shown in Figure 1, alongside similar metrics for transactions and rental growth. Sales activity in London reversed the falls seen last quarter but rents in the capital are still falling according to the ONS index, compared to growth of over 2% in the rest of the country. However, this measure is based on rents paid for existing tenancies so does not respond to changes in the market very quickly.
Figure 1 – London vs. rest of England: values and transactions
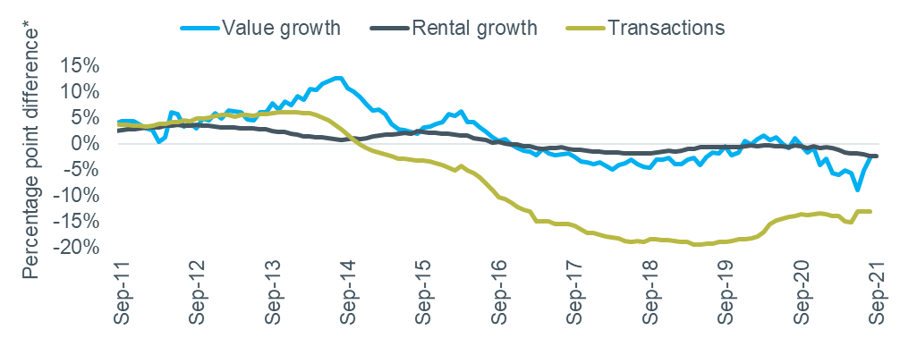
Source: ONS, Land Registry. *Positive = London performing better than rest of England.
Up-to-date rental market data is much more positive for London, although annual growth data for new lettings is now being compared against a baseline set in the middle of the pandemic (Q3 2020). The market was more volatile than usual in this period, so results should be treated with caution. Homelet’s September index recorded annual rental growth in London of 6.4%, only slightly trailing the 7.6% for the rest of the UK.
Rightmove’s Q3 index reported very strong annual growth of over 8% at national level, but London moved back into positive territory at +2.7% after a quarter-on-quarter increase of 3.6%. A summary of the latest data is shown in the table below. Rightmove’s sub-regional data suggests that the London recovery in central areas is picking up, with quarterly growth of 5.6% in inner London (vs. +1.7% for outer London).
Table 1 – Greater London rental data
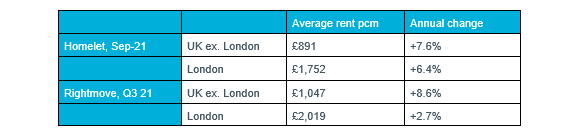
Source: Homelet Index (actual achieved rents), Rightmove Rental Trends Tracker (asking rents).
Market sentiment
The short-term outlook remained neutral in Q3, with three-month expectations for activity (-3) and prices (+6) hovering around the zero mark, according to the September RICS survey data., shown in Figure 2. By contrast the longer-term view has become very positive, particularly for prices. 12-month sales expectations were at a net balance of +28, with price expectations at +66.
Figure 2 – RICS Survey sales and price expectations, London
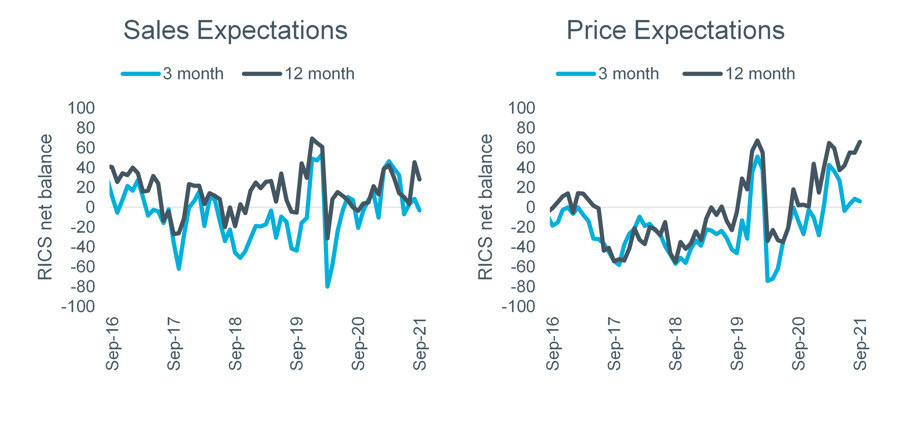
Source: RICS Housing Market Survey (Sep 2021).
Positive sentiment in the London rental market reached record high levels in Q3. Tenant demand increased to +63 in September, its highest mark since the series began in 2012. Set against continuing low levels of new instructions (-26), expectations for rental growth also reached a record high in August (+55) before falling back very slightly to +54 in September.
Figure 3 – RICS Survey rental indicators, London
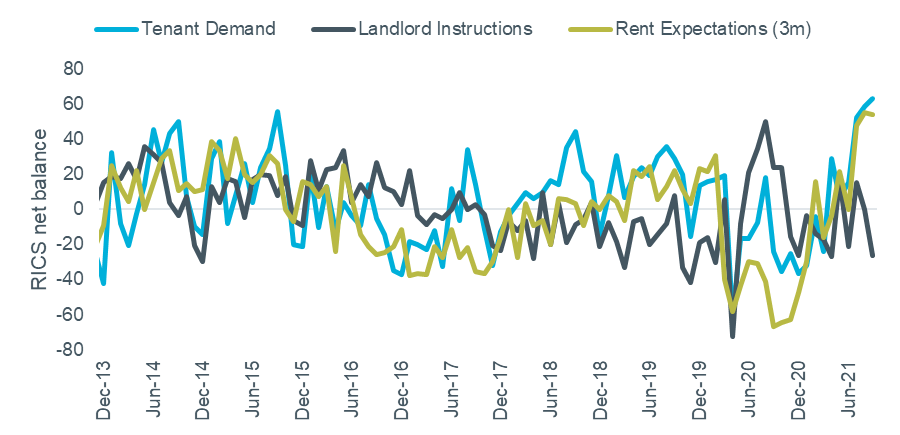
Source: RICS Housing Market Survey (Sep 2021).
Prime Central London
PCL sales values fell by 1.3% in Q3, taking the annual change to -5.1%, but rents bounced back strongly after a weak 18 months, according to Cluttons Prime Central London Index, the recent results of which are shown in Figure 4. Rental values grew by 16.7% on a quarterly basis, with annual growth at 12.2% and seeing most of 2020’s losses recovered.
Figure 4 – Cluttons Prime Central London Index
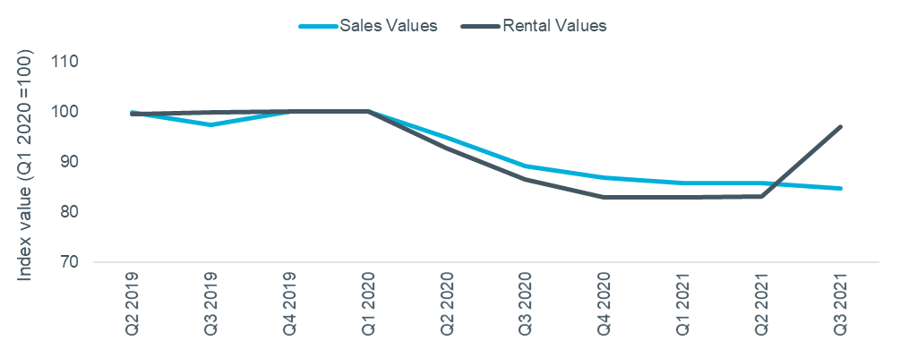
Source: Cluttons
Annual price growth of 4.5% was recorded in Prime Central London for Q3 by LonRes. Transactions were 10% higher than a year earlier, with stock levels 6% lower. 72% of properties have been on the market for over three months and 43% have been reduced in price, suggesting there is still a gap in expectations between buyers and vendors.
The PCL rental market recovered strongly in Q3, with values up 11.6% compared to Q2. The volume of lettings agreed was up 32.5% over the same period.
Super Prime
The London super prime market, defined as £10m+ sales and £5k+ per week lettings, has been resilient through the pandemic, according to the LonRes data shown in Figure 5. Sales activity only dipped slightly last year and is now in line with pre-pandemic trends. Lettings have been increasing in general and Q3 was the highest figure since the data series began in 2013.
Figure 5 – super prime sales and lettings activity
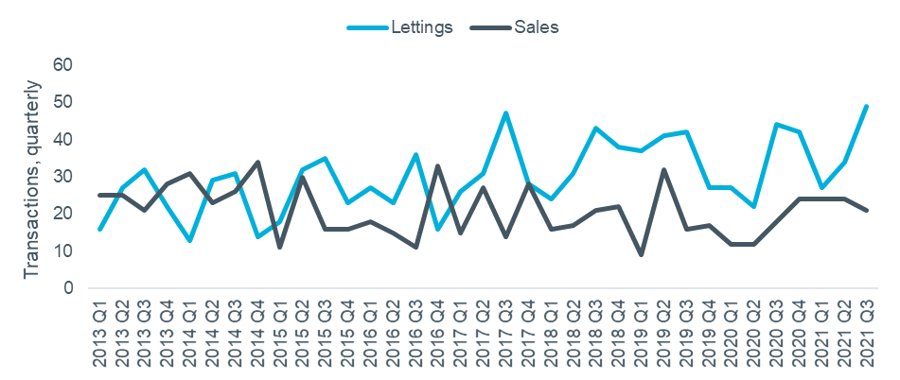
Source: LonRes
Cluttons agent view: James Hyman, head of residential agency
The rental market recovery picked up pace in Q3, with demand driven by corporate tenants returning and executives in the City and Canary Wharf heading back to their offices. The sub-£1000 per week market in particular is extremely active, driven by graduates starting jobs, the opening of universities, and the return of international students. Demand is now exceeding supply and leading to offers 5-10% over asking in some cases. The super prime lettings market has been quieter.
On the sales side, limited stock – much of which is either incompatible with sellers’ requirements or priced beyond expectation – is hampering the market. Where pricing is more in line with public perception deals can be done, but unless a property has unique features that make it desirable, vendors must get more realistic on pricing. More stock will come on to the market at the end of the year as vendors start to accept values may not bounce back. More freedom to travel might mean international owners look to sell if they need to raise capital on the home front.