Development review Q1 2022

So far 2022 has been business as usual for housebuilding, with output very much in line with recent trends both nationally and in London.
However, the scheduled end of Help to Buy is one year away and could lead to a significant reduction in new supply – last year’s changes to eligibility appear to have reduced take up by around 30%.
National overview
Weekly energy performance certificates for new homes provide the most up-to-date indicator of new housing supply and are shown in Figure 1. Over the 15 weeks of 2022 so far, around 69,000 new build completions were recorded, 5% below the equivalent period last year. This trend continuing would result in around 233,000 homes built across the full year, compared to 245,000 in 2021.
Figure 1 – EPCs for new build, England, weekly
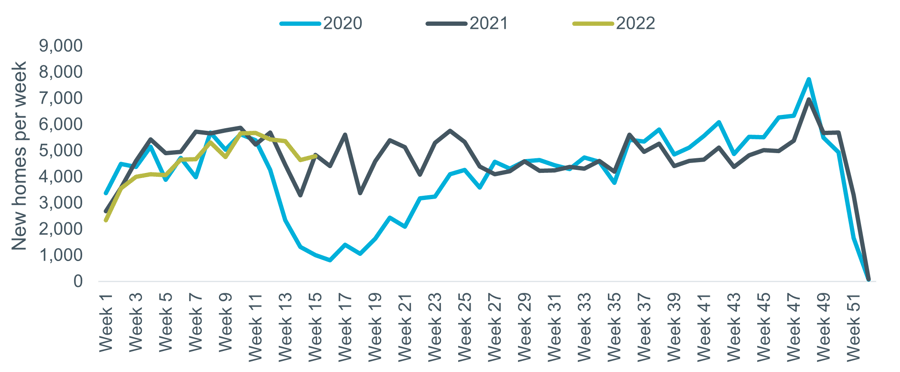
Source: DLUHC
Figure 2 shows new build activity (again represented by EPC data) plotted against total transactions, indexed to the end of 2019. Both fell by around 15% due to 2020’s lockdowns but, while overall transactions now sit 17% higher than they were pre-pandemic, the supply of new homes is around 4% lower.
Figure 2 – Total transactions vs. new supply
Source: DLUHC, HMRC
Help to Buy – the endgame?
The Help to Buy Equity Loan scheme is scheduled to end in March 2023, having been modified from April 2021 to exclude non-first time buyers and introduce regional price caps. Figure 3 shows a comparison between the average completions per calendar month under the previous and current schemes. So far, the changes appear to have reduced take up of the scheme by around 30%, although it is the early stages with only a few months of data available under the new conditions.
Figure 3 – Help to Buy average monthly completions comparison

Source: DLUHC. Note: Previous scheme from April 2016 when 40% London HTB was introduced.
Planning and building lead times mean that sites today need to be prepared for the post-HTB environment, but unanswered questions mean this remains unclear. Will the government or the industry introduce a replacement equity loan scheme or other types of incentives? Will shared ownership or First Homes make up any shortfall from the loss of Help to Buy? As things currently stand there is a risk that the end of the scheme could lead to a significant fall in housing delivery in some markets.
London has been impacted least by the 2021 change – it already had over 95% first time buyers (vs. 85% or lower in other regions) and the maximum purchase price remained at £600,000. However, this could mean that the complete withdrawal of the scheme is even more of a cliff-edge for developers in the capital, particularly in lower value areas and regeneration zones where Help to Buy has been a significant driver of demand, especially since 2016 when the maximum loan size doubled to 40%.
London development
The new homes market in London continued to perform well in Q1, according to Molior’s latest data, although the data making up the headline figures is affected by volatility and large deals in some cases.
The number of sales recorded in Q1, over 6,000, was the highest since early 2018, driven by Help to Buy and continued demand from Build to Rent investors. Starts fell by 11% compared to Q4 but were higher than any other quarter since Q4 2019. Completions were down by over 30% on a quarterly basis, but this metric has been volatile and the overall trend is relatively positive.
Table 1 – London Development Data, Q1 2022
The annual time series data is shown below in Figure 6, with starts and sales increasing on this basis over the past year and completions holding approximately level. Overall, around 57,000 units are currently under construction across the capital, 2% higher than last quarter but 13% fewer than the 2018 peak.
Figure 6 – Quarterly Development Trends, London

Source: Molior
The latest new build data for London based on weekly Energy Performance Certificates is shown in Figure 1. Activity over the first quarter was 18% below the equivalent period in 2021, which would result in around 33,000 homes being built across the full year, compared to 40,000 last year.
Figure 7 – EPCs for new build, London, weekly
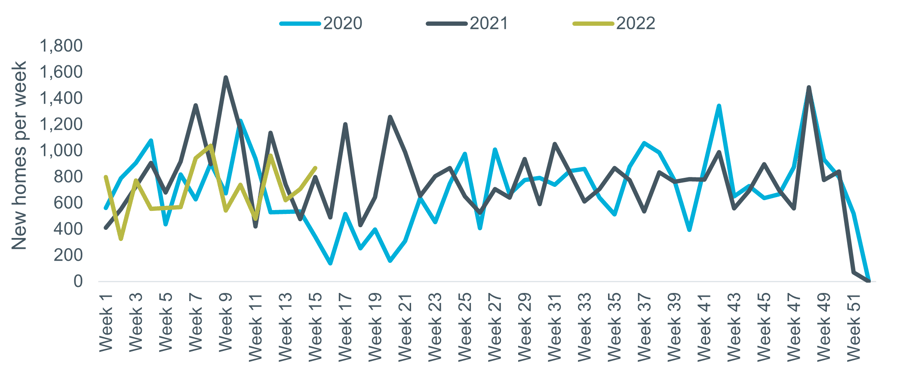
Source: DLUHC