England residential development Q4 2020

Q4 saw the residential development sector try to make up lost ground from the first lockdown, partially succeeding.
Figure 1 compares the weekly EPC data for 2018 and 19 against 2020, with a peak shortfall of almost 31,000 reached in early July. By the end of the calendar year this gap fell to 23,000, with total output around 10% lower than the last two years.
Figure 1: EPCs for new build, weekly

Source: MHCLG
November saw the release of the official net additional dwellings data for 2019/20. While this does not reflect the recent impact from Coronavirus (with only one week of the data overlapping with the first lockdown), it provides a detailed breakdown of the types of development happening around the country. Figure 2 shows the data over the past 15 years for England, suggesting that the growth in output since 2012/13 already slowed last year before any impact from the pandemic, with a significant gap remaining to the government’s target of 300,000 net new homes per year. With 2020/21 figures likely to be lower, Help to Buy being scaled back, plus proposals for major planning reform being considered, new homes supply could be under pressure in the next few years.
Figure 2: Net additional dwellings, annual
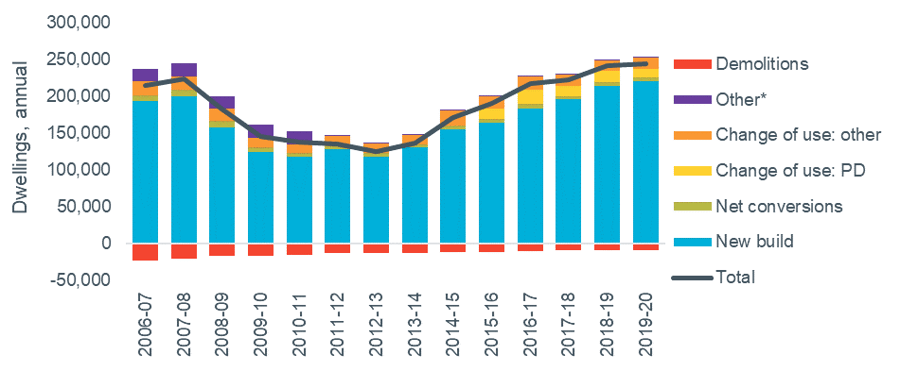
Source: MHCLG (*Other = ‘net other gains’ plus Census adjustment)
Figure 3 shows the net additions at district level for 2019/20, as a proportion of existing homes. With national delivery of 244,000 against existing stock of 2.4m, approximately 1% new homes were added, so the map shows where this average level has or hasn’t been met locally.
Figure 3: Net additional dwellings as % of existing stock, 2019/20
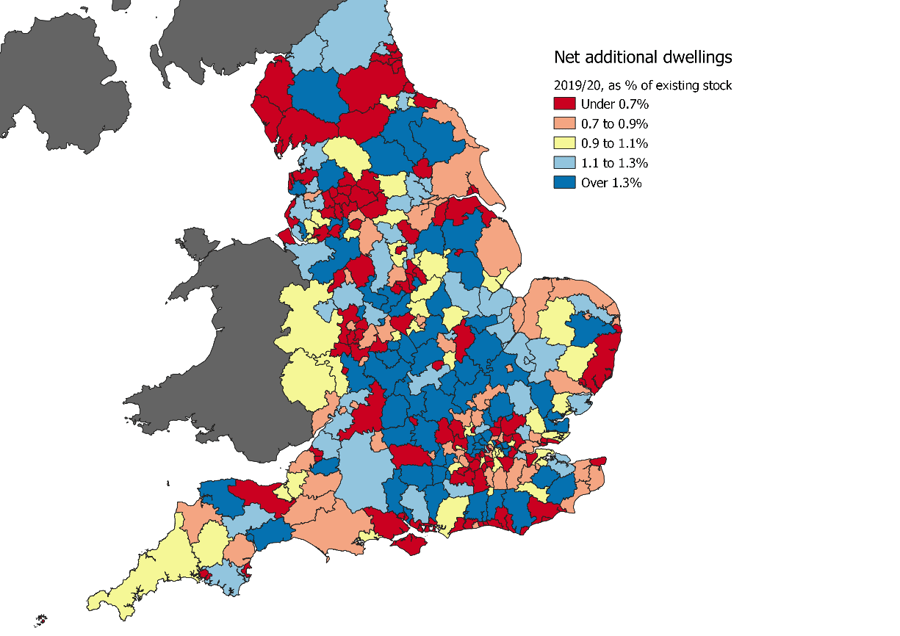
Source: MHCLG
Housing delivery test
The housing delivery test is a planning policy tool to measure the supply of homes compared to estimates of housing need and enforce conditions on those falling behind. The latest results were published in January and showed that the strongest sanctions will be applied in 55 local planning authorities (out of 324). These delivered less than 75 per cent of their housing requirement in the three years to March 2020 so will be subject to a presumption in favour of sustainable development. A further 19, who did not hit 85%, will have an additional buffer applied to their future housing requirements. The 33 LPAs between 85 and 95% must produce an action plan setting out how they will avoid future under-delivery, leaving 217 who passed the test with no sanctions.
Affordable housing
The new build affordable housing supply data is shown in Figure 4, with around 53,000 homes delivered in 2019/20. This was very similar to the previous year, mirroring the trend in the overall development figures above. Almost 90% of the affordable housing supply was shared ownership or affordable rent homes, with delivery of social rent remaining low. Affordable housing as a share of all net new homes was again 22%.
Figure 4: New build affordable housing supply by tenure, annual

Source: MHCLG (Excluding acquisitions. Affordable Rent includes London Affordable Rent and Intermediate Rent)