Residential development Q1 2021

UK residential development output appears to have fully recovered, albeit recent activity has not made up for the drop in supply in Q2 2020. New build sales and development activity in London remains slow, but agents and developers are positive about the longer-term outlook.
Around 60,000 new homes were completed in the first 12 weeks of 2021, 5% ahead of the same period last year, i.e. before the first lockdown required construction sites to temporarily close. Figure 1 compares the weekly EPC data for 2019, 20 and 21, and shows that while residential development output appears to have now fully recovered, it is not significantly making up for the drop in supply in Q2 2020.
Figure 1: EPCs for new build, weekly

Source: MHCLG
With activity in the wider market very high at the end of 2020 and into 2021, the levels of new supply shown above are perhaps lower than might be expected. We saw last quarter that, even pre-pandemic, growth in new house building had stalled and that one of its key drivers, Help to Buy, was being scaled down from April 2021.
The previous Help to Buy scheme was open to any buyers of a new build home up to £600,000 (in England). The new version is open only to first time buyers and also introduces regional price caps. First time buyers made up 83% of total users of the scheme in the three years to September 2020. With average annual sales of 49,000 over that period, we might expect 8,000 less sales per year purely due to excluding home movers.
The effect of the caps will be highly location dependent. Figure 2 is a map showing the average value of homes purchased by first time buyers through the scheme in the 12 months to September 2020 at local authority level. The North West, Yorkshire and Humber, and West Midlands appear to be facing the largest impact, with districts such as South Lakeland, Harrogate and Warwick having values significantly in excess of the caps.
Figure 2: HTB Equity Loan, average FTB values by local authority, 12m to Sep-20
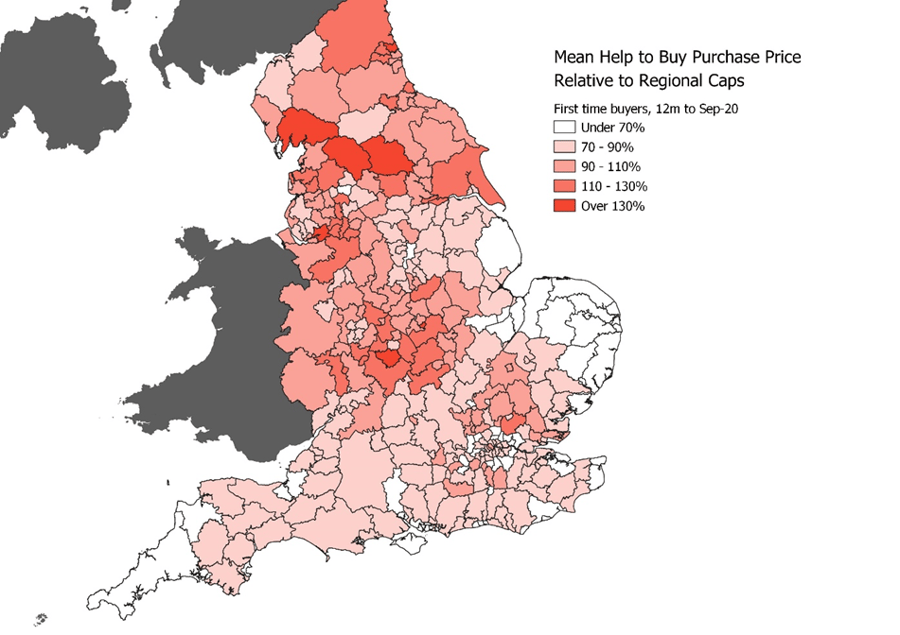
Source: MHCLG
Assuming developers don’t adjust their product to suit the new caps, a simple model based on the above data suggests further losses of around 30% of current sales, equivalent to 12,000 per year. Combined with the loss on non-FTBs, overall take-up of the Equity Loan scheme would then fall from almost 50,000 per year to under 30,000. The ‘lost’ 20,000 homes due to these criteria would be equivalent to around 8% of recent levels of total supply (measured by net additional dwellings, c.244,000 for 2019/20).
London Development
New build sales and development activity in London was slow in Q4 and fell further in Q1. The Q1 Molior data recorded falls across their three main metrics (starts, completions, sales) compared to Q1 2020, as shown in Table 1. Sales activity was subdued and reached its lowest figure since 2012, while starts were the lowest since 2011.
Table 1: London Development Data, Q1 2021

Source: Molior
The annual time series data is shown below in Figure 3 with all three metrics dipping slightly on this basis in Q1. In combination, this activity means there are around 58,000 units currently under construction across the capital.
Figure 3: Quarterly Development Trends, London
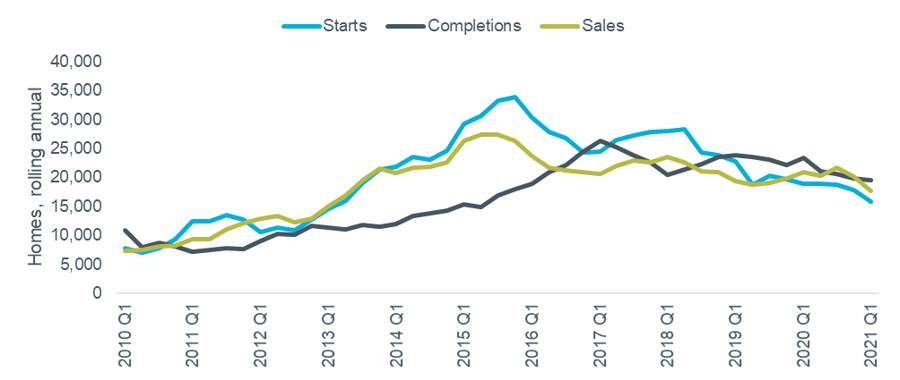
Source: Molior
Molior’s April report explained that ‘standard’ sales (i.e. to individual buyers) have been holding up well, particularly for schemes able to complete in time to take advantage of Help to Buy and the SDLT holiday deadline. However, the uncertain rental market continues to put institutions off investing, so bulk deals are lower than usual and impacting the overall figures.
Despite the current market conditions, Molior reported that agents and developers were positive about the longer-term outlook, with ‘London’s reputation, safe haven status, and personal connection with many buyers’ drivers for a recovery. The developers are ‘well-capitalised’ and happy with activity at present, with most not feeling the need to discount heavily in order to increase sales rates.
Energy Performance Certificates for new dwellings are another measure of completions, with the latest data shown in weekly form in Figure 4. In 2021 so far, new supply is tracking slightly ahead of the levels seen last year prior to the first lockdown at the end of March. After 12 weeks of the year, about 600 more EPCs were logged in 2021 compared to 2020. This only partially offsets the c.4,000 homes ‘missing’ due to lockdown site closures in 2020.
Figure 4: EPCs for new build in London, weekly

Source: MHCLG