UK economic outlook Q4 2020

The restrictions due to the second lockdown – the so-called ‘circuit-breaker’ – caused a further fall in GDP in November, 2.6% below the previous month. On an annual basis, output has fallen 8.9%, and is currently 8.5% below the pre-pandemic level (February 2020).
Figure 1 shows the monthly GDP estimates. Note that the ONS warned that the estimates for November 2020 are subject to more uncertainty than usual due to the challenges estimating GDP in the current conditions, so these results are likely to be revised in future releases.
With parts of the economy opening up in December, followed by strict restrictions from January, plus cross-border trade issues resulting from Brexit changes, the next few months are likely to bring equally volatile results.
Figure 1 – Monthly GDP estimates
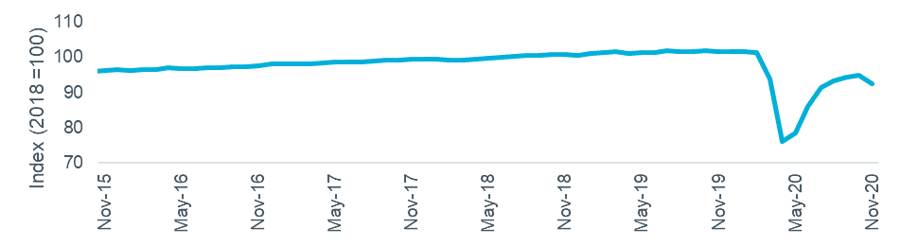
Source: ONS
Other economic indicators, as shown in Figure 2, give a mixed picture towards the end of 2020. Consumer confidence remained strongly negative, and while it fell back the savings ratio was still well above typical levels, both of which suggest that households are concerned about their financial positions. The December PMI data for services was neutral, with hopes of recovery offset by concerns over Brexit trade uncertainty and further pandemic restrictions.
Figure 2: Other economic indicators

Source: GfK/NOP, IHS/Markit, ONS
Figure 3 shows the change in 2021 GDP forecasts collected by the Treasury from a range of external economists. This shows that the optimism for a strong bounce back has reduced, with forecasters expecting restrictions on travel and business to continue through more of the first half of 2021. Within this average there is a significant range of views; the full set of forecasts (see p7 of the Treasury’s January Forecast Comparison report) stretched from -3.0% to 6.1%. The official central economic scenario from the OBR is +5.5%, published in November.
Figure 3: 2021 UK GDP forecasts over time
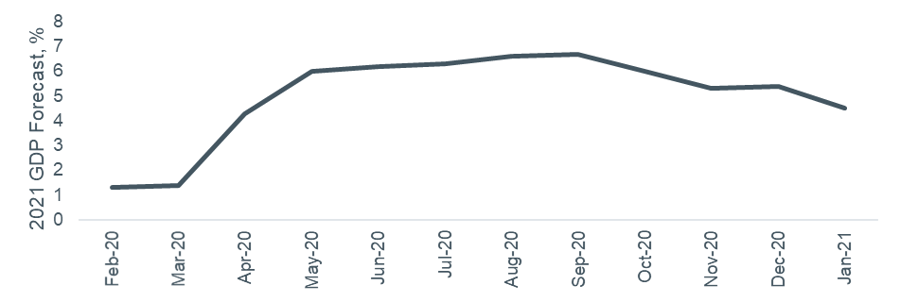
Source: HM Treasury (Average of new forecasts)
The Coronavirus Job Retention Scheme was extended again, this time to the end of April. Figure 4 shows how the number of employees furloughed jumped in early November as the second lockdown started, but the overall figures of around 3.8m at the end of December are less than half the peak of 8.9m in May.
Figure 4: Coronavirus Job Retention Scheme data
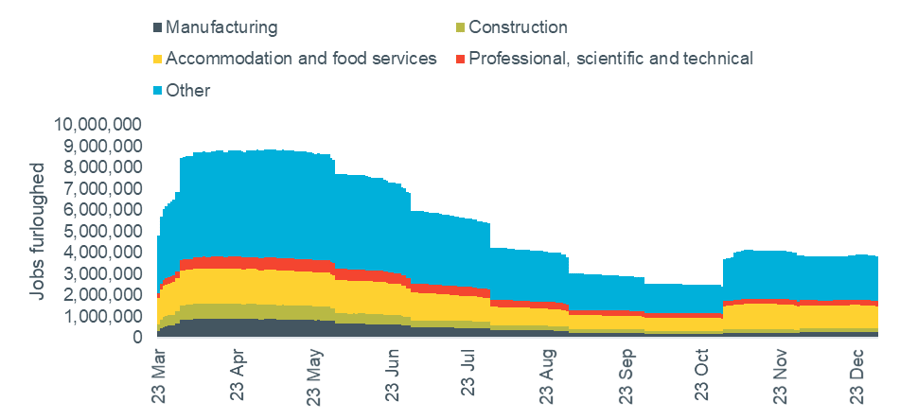
Source: HMRC
The headline unemployment rate hit 5% in the three months to November, the first time it has reached this level since 2016. This compares to 3.8% a year earlier and 4.4% in the previous quarter, showing steady growth despite the government support schemes.
Other measures of employment demonstrate a mixed picture, as shown in Figure 5. ‘Hours worked’ have recovered from their May low to be 7% down annually, while there were 2.7% fewer paid employees in December than a year earlier. Median pay has risen throughout the pandemic, highlighting the unequal impact on the economy with many lower paid roles lost or furloughed.
Figure 5 – Economic indicators: Hours worked, paid employees and median pay
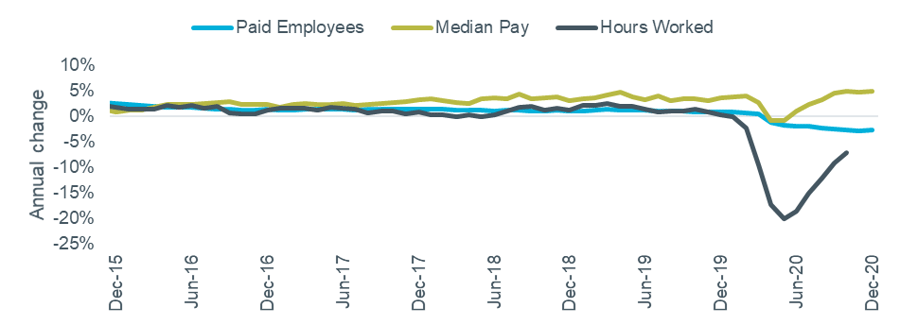
Source: ONS Labour Force Survey and HMRC PAYE Real Time Information
The Bank of England Q4 2020 Credit Conditions Survey reported a continuation of the trends seen last quarter, as shown in Figure 6. Lenders reported high demand for mortgaged purchases but continued to widen margins as a response to generally lower risk appetite.
Despite this, there was another small increase in the availability of high-LTV products. This is backed up by data from Moneyfacts showing 160 90% LTV mortgages available in January compared to only 70 last July – but still well down on the 779 on the market in March 2020.
Figure 6: Secured lending availability and demand
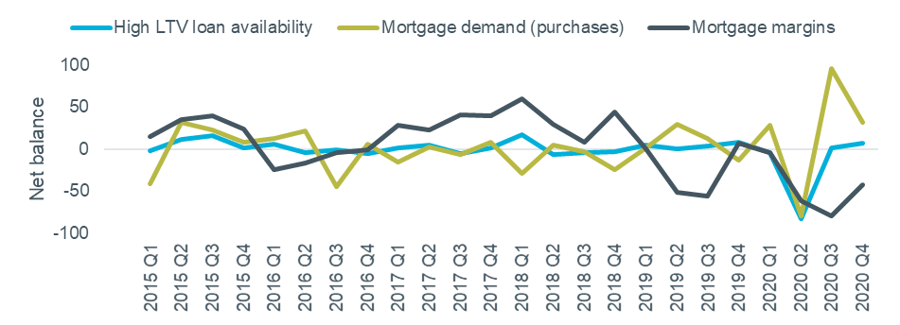
Source: Bank of England Q4 2020 Credit Conditions Survey. Note: Negative net balance = decreasing availability / decreasing demand / wider margins