UK rental market Q1 2022
The rental market started 2022 much as it left 2021, with demand well ahead of supply in all regions, rental growth over 10%, and huge competition for properties.
Looking ahead, new supply is starting to respond but the trend of high growth looks set to stay in the short term.
National data
Sentiment at national level continued to point to rental growth, according to the latest RICS Survey results. ‘Landlord Instructions’ turned positive in March for the first time in 20 months, but only slightly with a net balance of +6. ‘Tenant Demand’ increased again, climbing to +54 (vs. +43 in December). With demand continuing ahead of new supply, ‘Rent Expectations’ also increased again, to +64 (Dec +57). Figure 1 shows these metrics along with the ONS rental index, which moved above 2% for the first time in five years, to 2.2% annual growth in March. Similarly to Q4, this is a relatively large increase given the index measures all rents paid rather than new lettings, so typically underestimates rental value growth among new listings.
Figure 1 – Rental growth vs. RICS rental indicators
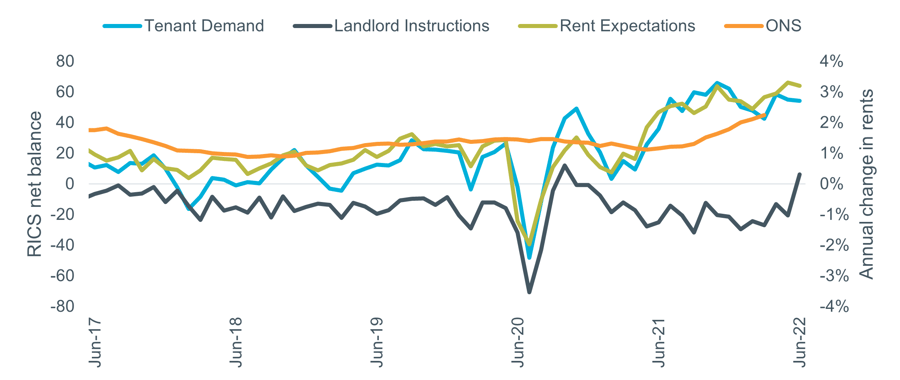
Source: RICS Housing Market Survey (Mar 2022), ONS IPHRP (GB). Note: RICS data lagged 3 months
Rightmove’s Q1 Rental Price Tracker recorded very high rental growth nationally and across all regions. Annual growth of 9.2% in the East Midlands was the slowest region and the rate of growth outside London exceeded 10% for the first time (+10.8%). Rightmove noted that tenant demand was up 6% but available properties down by 50% compared to last year. Homelet’s March index also recorded relatively high levels of rental growth across the country.
Regional data
A summary of the latest regional rental data is shown in the table below.
| Region | Homelet, Mar-22 | Rightmove, Q1 2022 | ||
|---|---|---|---|---|
| Average rent | Annual change | Average rent | Annual change | |
| Greater London | £1,770 | 11.6% | £2,193 | 14.3% |
| South East | £1,148 | 5.7% | £1,535 | 9.6% |
| East Of England | £1,044 | 5.8% | £1,331 | 10.3% |
| South West | £1,017 | 8.7% | £1,202 | 12.2% |
| West Midlands | £804 | 7.8% | £963 | 10.3% |
| East Midlands | £749 | 5.3% | £955 | 9.2% |
| North West | £871 | 10.5% | £937 | 12.8% |
| Yorkshire & Humberside | £743 | 8.0% | £848 | 11.2% |
| North East | £589 | 8.7% | £732 | 10.0% |
| Wales | £726 | 7.2% | £882 | 13.9% |
| Scotland | £770 | 12.9% | £852 | 11.2% |
| UK exc. Greater London | £893 | 6.6% | £1,088 | 10.8% |
Arrears and possessions
Households in arrears on their rent grew during the pandemic but evictions were banned in most cases, raising fears of a flood of repossessions once restrictions were lifted. The latest data shows both landlord repossessions and claims rising but remaining well below pre-pandemic levels, as shown in Figure 2.
Over 14,000 claims were issued in Q4, 44% of the 2015-19 average. Actual repossessions fell to 2,700, only 30% of their previous typical level.
Figure 2 – Landlord possessions, quarterly
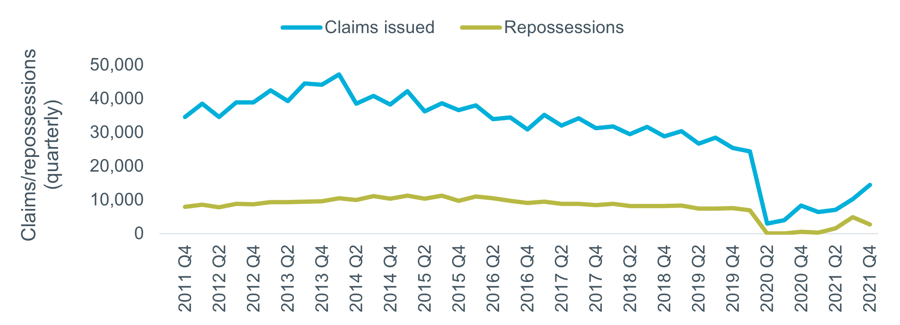
Source: HMCTS.