UK rental review Q4 2020
After much volatility in Q2 and 3, sentiment in the national lettings market (outside London) settled back towards pre-pandemic trends in Q4, despite continuing lockdown restrictions.
The RICS Survey data in Figure 1 shows ‘Tenant Demand’ at +15 in December, compared to its 2019 average of +16. Similarly, ‘Landlord Instructions’ at -12, and ‘Rent Expectations’ at +20, are broadly back in line with their 2019 averages of -15 and +23. With the ONS index of rents paid steady at around 1 to 1.5% growth over the past two years, we can expect more of the same in the short term.
Figure 1: Rental growth vs. RICS rental indicators
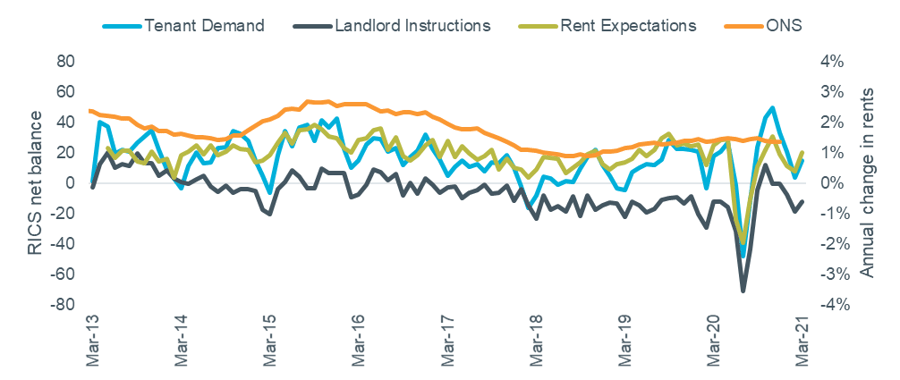
Source: RICS Housing Market Survey (Dec 2020), ONS IPHRP (GB). Note: RICS data lagged 3 months.
Rightmove’s headline figure of 3.7% national annual rental growth, from their Q4 2020 Rental Price Tracker, obscured some significant variation across different markets. They reported a large urban/suburban divide, with values falling year-on-year by 12.4% in Inner London, 10.0% in Edinburgh, and 5.3% in Manchester city centre. This is driven by strongly increasing supply, rather than falling demand.
Homelet’s December index reported annual growth of 2.7% nationally, rising to 5.7% excluding London. This is based on achieved rents for new tenancies. Their report noted that the upward pressure on rents was driven by the need for more space, which they expected to continue into 2021 despite the economic impact of the pandemic.
On average households in the private rented sector have lower incomes than owner occupiers (£33,000 vs. £46,000, according to the 2018/19 English Housing Survey), and Figure 2 shows how the pandemic has impacted lower paid workers the most, especially in May and June 2020. This has been particularly strong in employment sectors such as retail and hospitality.
Figure 2: Furlough by income band
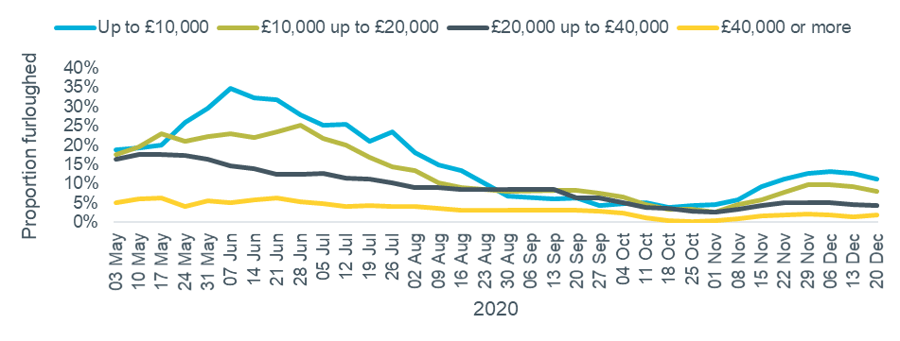
Source: ONS – Opinions & Lifestyle Survey
Figure 3 shows that households in the PRS tend to have lower levels of savings, with over 50% of private renters in full time work reporting zero savings.
Figure 3: Savings by tenure and employment status
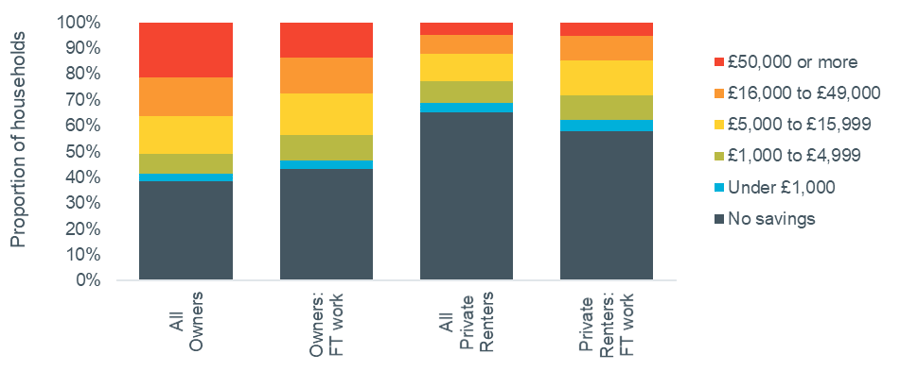
Source: 2018/19 English Housing Survey
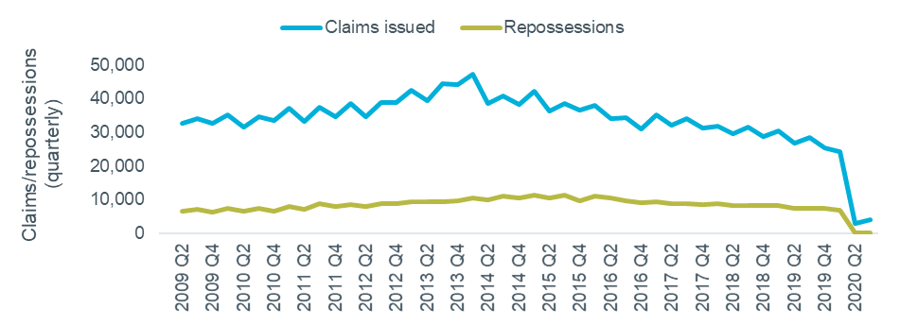
With the eviction ban extended again, apart from in the most extreme cases, the data on landlord possessions continues to show very low levels of activity, as seen in Figure 4. But a recent survey for the National Residential Landlords Association found that seven per cent of private renters (equivalent to 840,000 people in England and Wales) could have fallen behind on their rent payments as a result of the pandemic.
Figure 4: Landlord posessions, quarterly
Source: HMCTS
The preceding three pieces of analysis suggest a significant problem could potentially be building up in the PRS, with the finances of large numbers of tenants negatively impacted by the pandemic, and little to fall back on.

