UK sales review Q1 2021

A year on from the first lockdown and the UK housing market continues to defy the negative economic news, with values up again in Q1 and activity remaining strong. On an annual basis prices are up 5.7% according to the Nationwide index, and mortgage approvals in February were 20% higher than the same month a year ago.
While parts of the economy like leisure and non-essential retail were closed throughout Q1, the housing market was open, and boosted by the stamp duty holiday that was expected to end on 31 March. The phased extension announced in the Budget is likely to sustain demand and spread out activity that may otherwise have been rushed through, avoiding some of the ‘cliff edge’ effects typically seen when tax changes occur.
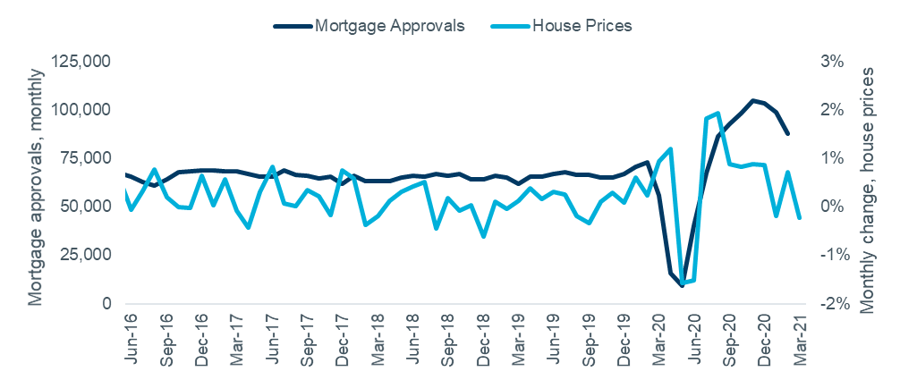
Figure 1 shows the monthly number of mortgage approvals alongside Nationwide’s monthly measure of house price growth. Growth in both measures slowed slightly compared to late 2020.
Figure 1: UK House prices and mortgage approvals, monthly

Source: Nationwide HPI, Bank of England. Note: both seasonally adjusted.
Transactions
The official ONS transaction index now covers the full calendar year, showing sales down by over 20% compared to 2019. As noted previously, it is likely that the lag in recording sales is larger than usual due to the impact of the pandemic and these figures will be revised up in future data releases.
By contrast, the latest data from HMRC showed over 190,000 transactions in March. This is the highest figure since their data series began in 2005, and takes sales over the past 12 months to 1.2m, 2.7% higher than a year earlier.
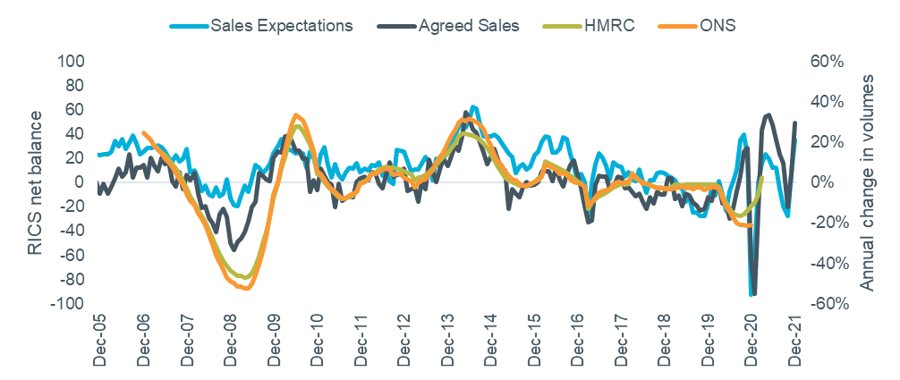
The latest results from the RICS Housing Market Survey saw further volatility. The ‘Sales Expectations’ measure, which looks forward three months, rose to +35 in March (compared to -19 in December). The backward looking ‘Agreed Sales’ measure also rose, to +50, compares to +16 last quarter. This suggests that high levels of activity may continue over the next few months, whether sustained by the by the extended SDLT holiday or more general demand.
In the past these results, when ‘lagged’ by nine months, have been a good predictor of short-term trends in activity. However, the market has been responding more quickly through the pandemic, and with more volatility likely this year it could be many months before a clear new trend emerges. Figure 2 shows the two survey metrics plotted against the two measures of actual transaction levels.
Figure 2: Actual transaction levels vs. RICS sales metrics

Source: RICS Housing Market Survey (Mar 2021), HMRC, ONS UK HPI. Note: RICS figures lagged 9 months. RICS and HMRC figures seasonally adjusted.
Rightmove reported that sales agreed in early March were 12% up on the same period a year earlier – what was then a strong pre-pandemic market. Average time to sell decreased to 51 days in March (57 in December). They also noted that new instructions were growing from their previous low levels, potentially adding some supply to balance out the high demand seen so far this year. Zoopla’s March index report also noted that supply of homes, particularly family houses, was starting to grow as lockdown restrictions lift and potential vendors become more comfortable allowing appraisals and viewings.
House prices
After finishing 2020 strongly house price growth has maintained momentum through Q1. Annual growth of 5.7% was reported by the Nationwide index for March, and although this was slower growth than last quarter their average price measure hit a new record high of over £232,000. The ONS index, based on completions so typically slower to react to the market, recorded annual growth of 8.6% in February. This is the highest level since 2014 on this measure.
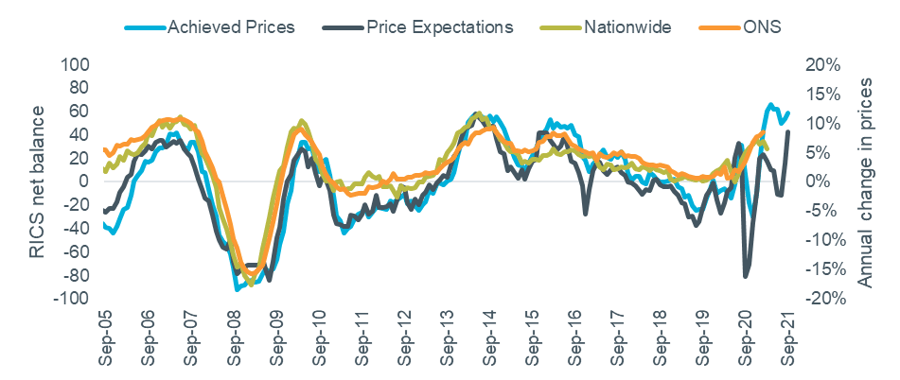
Figure 3 shows the RICS net balance of opinion data on values, compared to the two measures of house prices. After diverging last quarter, the two RICS metrics were similarly positive in the March survey. ‘Achieved Prices’ continued to record high values at +59 (vs. +62 in December) and ‘Price Expectations’ rose to falling to +42. This is the highest figure since early 2016 and is up from -11 in December. This suggests that the agents surveyed are expecting the recent high levels of growth to be sustained, after a more pessimistic view last quarter.
Figure 3: Actual value changes vs. RICS price indicators

Source: RICS Housing Market Survey (Mar 2021), Nationwide HPI, ONS UK HPI. Note: RICS data lagged 6 months.
Asking prices continued to rise in Q1 according to Rightmove’s index, which reported annual growth of 2.7%. While the pace of growth is down on the year end figure of +6.6%, this reflects higher base values in early 2020. Their April index saw a monthly jump of over 2% to an average of £328,000, taking annual growth in asking prices to 5.1%. Zoopla’s March index reported annual growth of 4.0%, a slight slowdown from December despite their other metrics suggesting continuing strong demand and low supply, summarised in the table below.
Table 1: Zoopla Market Metrics, year to date 2021 vs 2020

Source: Zoopla March Index
What happens next?
Q1 proceeded broadly as expected, with activity rising very strongly and values continuing to grow as the original stamp duty holiday end date approached. The outlook for Q2 and the rest of 2021 has been improved by Government policy actions that all give confidence to the housing market: the extension of the SDLT holiday, the introduction of a new mortgage guarantee scheme, and the extension of employment support measures. Combined with the success of the UK’s vaccine rollout, enabling more of the economy to reopen and life to return to normal, damaging ‘cliff edge’ effects should be minimised in the short-term.

