Wider South East Q4 2021

House prices and rents across the wider South East grew strongly in Q4, with annual increases of around 10% – in line with the national picture.
At local level the highest rates of house price growth continue to be seen in lower value markets and coastal areas, maintaining the key trend of the pandemic.
South East Sales Market
House price growth accelerated further in the wider South East in Q4. Annual growth hit double digits in both East Anglia and the Outer South East according to the latest Nationwide index results. Table 1 shows the latest regional index results, with Figure 1 showing the trend back to 2006.
Table 1 – Regional House Prices, Q4 2021
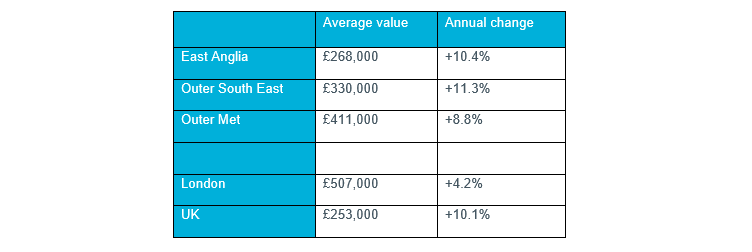
Source: Nationwide House Price Index (values rounded to £1000)
Figure 1 – House Price Growth: Wider SE, London and National
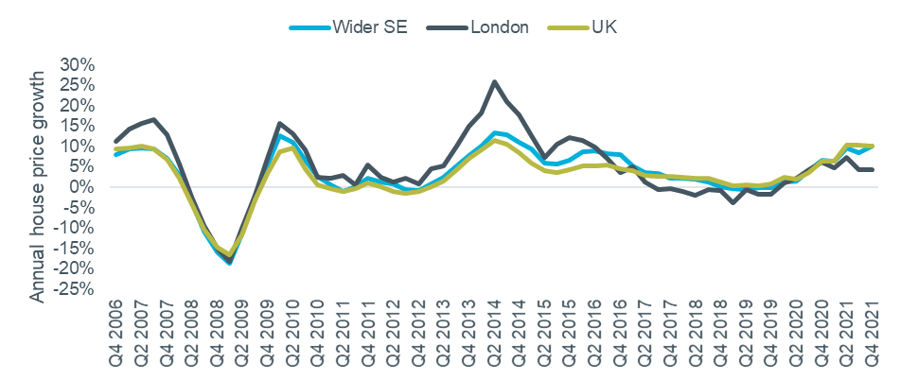
Source: Nationwide (Wider SE represented by average of ‘Outer Met’, ‘Outer SE’ and ‘East Anglia’ areas). Note Quarterly regional series uses different UK figure to main monthly index.
The measure of London values relative to the wider South East saw another large fall in Q4, to 1.50, compared to 1.53 in Q3. This is the lowest level since Q2 2013 and continues a falling trend since the peak of 1.75 in Q4 2015. The full data series is shown in Figure 2.
Figure 2 – Ratio of London to Wider South East Values

Source: Nationwide (Wider SE represented by average of ‘Outer Met’, ‘Outer SE’ and ‘East Anglia’ areas)
The map below shows annual house price growth at local level across the wider South East. Around half of the districts outside the capital (55 out of 109) are in the top 10%+ growth band, whereas this applies to only 2 of 33 London boroughs. Four London boroughs saw price falls in the year to November, with +3.5% the slowest rate of growth in districts across the rest of the East or South East. Hastings recorded the highest rate of growth again, followed by fellow coastal locations Maldon and Worthing.
Figure 3 – Annual House Price Growth at Local Authority Level, November 2021
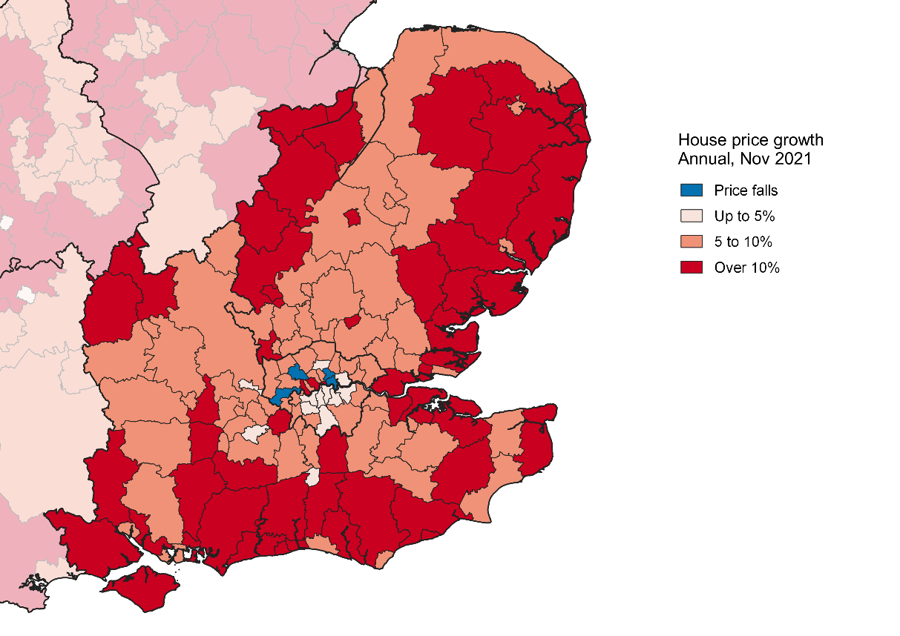
Source: Land Registry, 3-month smoothed data
South East Rental Market
Figure 4 shows rental growth data at regional and national level from the ONS. This is based on all rents paid so is slow to respond to changes in market conditions. Rents in the East continue to be the fastest growing on this measure, with annual growth of 3.2% in December, with the South East at 2.3% also ahead of the national average (1.8%). By contrast, rents in London fell by 0.1%.
Figure 4 – Rental Growth: Southern regions, London and National

Source: ONS Index of Private Housing Rental Prices
Analysis based on new lettings showed higher levels of inflation than the ONS index. The pace of growth slowed in Q4 according to Homelet’s December index, but Rightmove saw a further acceleration in rents, with annual growth approaching 10% in both regions.
Table 2 – Regional Rental Data, Q4 2021
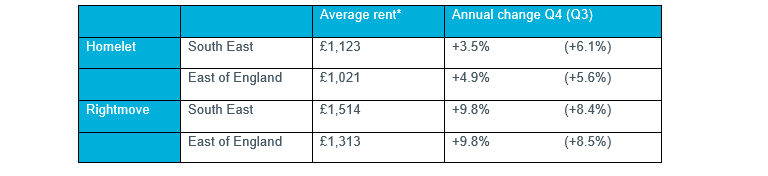
Source: Homelet Index (actual achieved rents), Rightmove Rental Trends Tracker (asking rents)