London sales & rental review Q2 2021
The mainstream London sales market has held up well through the pandemic but is lagging the very strong growth seen in other regions. Its rental market is weaker but showing signs of recovery.
Central London has seen both capital values and rents stabilise after suffering significant falls in 2020.
Greater London overview
The relative performance of the London market continued to lag the rest of England in Q2. As at the start of the year, this is driven by very strong price growth and activity levels in the regions more than any weakness in the capital, particularly in the sales market. The ONS index reported annual price growth of 5.2% for London in May, but this was the lowest of any region (or devolved nation). The equivalent figure from the Nationwide index in June was 7.3%, ahead of only Scotland.
Transactions and rental growth were also stronger outside London – the relative performance of all three metrics is shown in Figure 1. The gap in sales activity grew again in recent months, likely in part due to London containing a lower proportion of the most in demand properties – larger and detached homes.
Figure 1 – London vs. rest of England: values and transactions
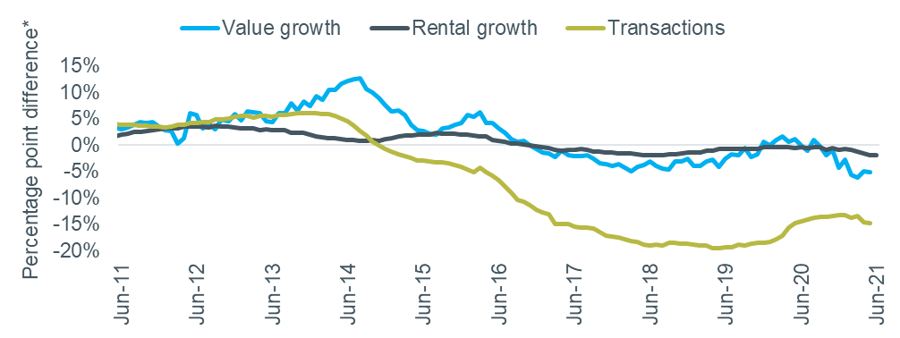
Source: ONS, Land Registry. *Positive = London performing better than rest of England.
London’s annual rental growth turned negative in the ONS index, falling to -0.1% in May and June. This measure is based on rents paid for existing tenancies so does not respond to changes in the market very quickly.
Other, timelier, data indicate that the larger falls in rents seen in late 2020 have bottomed out and are starting to reverse. Homelet’s June index saw Greater London rents return to annual growth of 1.5%, although this is against a baseline of early in the pandemic so the 1.3% increase since March is perhaps a more robust measure. Rightmove’s Q2 index, based on asking rents, reported quarterly growth of 1.6% for Greater London, taking the annual change to -3.1% against +6.2% outside the capital. A summary of the latest data is shown in the table below.
Table 1 – Greater London rental data

Source: Homelet Index (actual achieved rents), Rightmove Rental Trends Tracker (asking rents)
The difference in performance between markets within London moderated in Q2, with similar quarterly growth of 1.3 and 1.7% recorded in inner and outer London respectively, according to Rightmove’s index. Rightmove also reported that tenant demand in inner London in June was 18% higher than a year earlier.
Sales market sentiment cooled in Q2, with short-term expectations for activity (-7) and pricing (-3) turning negative in June, according to the latest RICS survey data, shown in Figure 2. The longer-term view was also less upbeat than three months ago but remained well into positive figures at +10 for volume of sales and +42 for prices.
Figure 2 – RICS Survey sales and price expectations, London
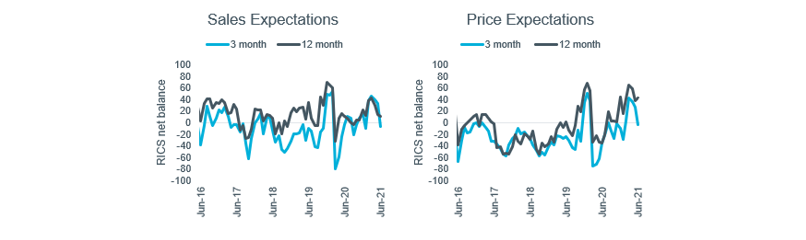
Source: RICS Housing Market Survey (June 2021)
By contrast, London’s rental market sentiment improved in Q2, with tenant demand growing to +15 in June (up from -24 in March) and new instructions falling slightly to -21 (vs. -17). Expectations for rental values moved into positive territory in May for only the second time in 15 months, but ended up at zero for June.
Figure 3 – RICS Survey rental indicators, London
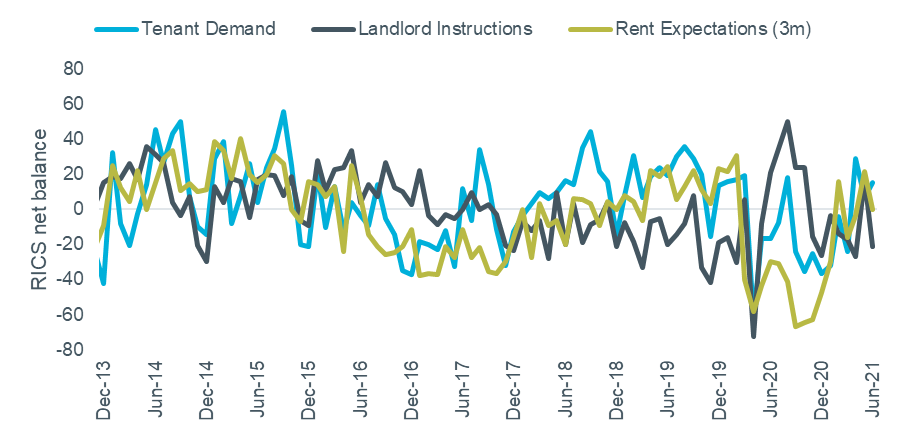
Source: RICS Housing Market Survey (June 2021)
Prime Central London
Annual price growth of 0.1% was recorded in Prime Central London[1] for Q2 by LonRes, with transactions 180% higher. This figure is inflated due to the market in Q2 2020 being disrupted by lockdown, but more meaningful comparison against the 2015 to 2019 average saw an increase in sales volumes of around 60%. Stock levels were 6% higher than a year earlier.
The PCL rental market is showing signs of recovery but remains relatively weak. 17% more rentals were agreed in Q2 compared with Q1. Values grew by 1.8% over that period but remain 9.8% lower than Q2 last year.
Agent view – James Hyman, head of residential agency at Cluttons
Central London rents and capital values remained relatively flat in Q2. In the sales market, a lack of supply has meant vendors holding firm on pricing for the time being. But the second half of the year could see more discounting as new instructions come to market and add some competition.
Letting activity improved in Q2 as the return of more workers to the office drove an increase in demand from corporate tenants. With this trend likely to continue in Q3, plus the return of students for the new academic year, there is clear scope for rental growth over the rest of the year. International visitor and tourist levels remain well below pre-pandemic numbers, so the recovery of local rental sub-markets servicing these groups may lag those more dependent on workers and students.
Annual price growth of 0.1% was recorded in Prime Central London[1] for Q2 by LonRes, with transactions 180% higher. This figure is inflated due to the market in Q2 2020 being disrupted by lockdown, but more meaningful comparison against the 2015 to 2019 average saw an increase in sales volumes of around 60%. Stock levels were 6% higher than a year earlier.
The PCL rental market is showing signs of recovery but remains relatively weak. 17% more rentals were agreed in Q2 compared with Q1. Values grew by 1.8% over that period but remain 9.8% lower than Q2 last year.
[1] PCL defined as SW10, SW1A, SW1W, SW1X, SW3, SW7, W1J, W1K and W8