UK economic outlook Q2 2002

Q2 saw further volatility for the economic recovery, with monthly GDP growth in May above expectations but other indicators turning increasingly negative.
Inflation continues to rise despite increases in interest rates, causing household budgets to be squeezed as real disposable incomes fall.
GDP and output
Economic growth surprised on the upside in May, after a disappointing April. There was a month-on-month rise of 0.5%, taking annual growth to 3.5%. Since the end of 2019 GDP has grown by 1.4%, after falling to a trough of over -25% in the early stages of the pandemic. Recent GDP growth trends are shown in Figure 1.
The ONS noted that growth in ‘human health and social work activities’ contributed strongly to the May results, with a large rise in the numbers of GP appointments offsetting the scaling down of the ‘Test and Trace’ and vaccine programmes. This highlights the ongoing impact of the pandemic on interpreting any data and results.
Figure 1 – Monthly GDP estimates

Source: ONS
Inflation rose again in Q2, with CPI climbing to 9.4% in June. This is the highest level for 40 years, driven by very large increases in food and fuel prices. The minutes from the Bank of England’s June Monetary Policy Committee meeting noted that inflation is expected to peak at over 11% in October this year, then take two years to return to the 2% target level. The Committee voted to raise the base interest rate to 1.25%, the fourth rise this year and the fifth consecutive meeting at which there has been an increase.
Figure 2 – Inflation (CPI)

Source: ONS
Economic sentiment has unsurprisingly been volatile since early 2020 and consumer confidence hit a record low of -41 in June, driven by a particularly negative outlook for the wider economy. Consumers were less negative about their own personal finances, with the relatively low savings ratio appearing to corroborate this. Services PMI fell back from its record high but remained in positive territory. Figure 3 shows the latest data.
Figure 3 – Other economic indicators

Source: GfK/NOP, IHS/Markit, ONS. Note: Services PMI rebased from 0-100 to +/-50.
Expectations for economic growth this year declined in the most recent figures collected for the Treasury Forecast Comparison reports (time series data shown in Figure 4). The median new forecast in the July report was for growth of 3.6%, compared to 5.7% in January. The official central economic scenario from the OBR remains that published in March, with growth of 3.8% expected. The Bank of England’s Financial Stability Report, published in July, noted that “the economic outlook for the UK and globally has deteriorated materially”, due to inflationary pressures and tighter monetary policy.
Figure 4 – 2022 UK GDP forecasts over time
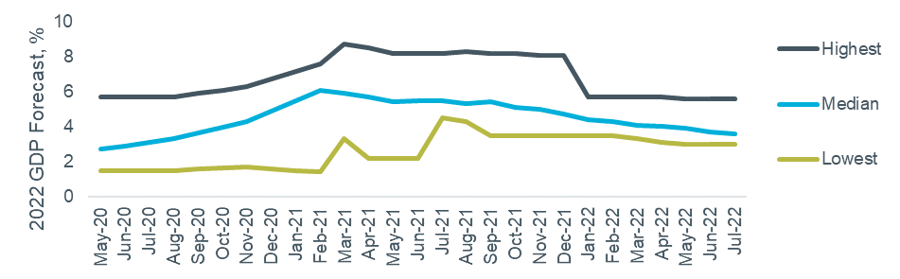
Source: HM Treasury (Month = date of report, data is the range of forecasts made in last three months)
Employment
The employment market continues to see companies struggling to recruit, with unemployment low and the inactivity rate high. The unemployment rate remained at 3.8%, in line with three months ago and with its pre-pandemic level. The latest data for the additional employment indicators, as shown in Figure 5, indicate further growth in these metrics. In June there were over 560,000 more paid employees now in work compared to the pre-pandemic peak in February 2020, although this continues to be offset by lower numbers of self-employed workers.
Figure 5 – Economic indicators: Hours worked, paid employees and median pay

Source: ONS Labour Force Survey and HMRC PAYE Real Time Information
A comparison of the employment measures against pre-pandemic levels, shown in the table below, highlights the changes in the labour market over the past two years. Hours worked are still slightly lower than their December 2019 level, whereas median pay is almost 15% higher.
Table 1 – Employment data
| Annual growth / level | vs. December 2019 | |
|---|---|---|
| Paid Employees (Jun-22) | +3.0% | +2.0% |
| Hours Worked (May-22) | +5.9% | -0.4% |
| Median Pay (Jun-22) | +6.6% | +14.8% |
| Unemployment (May-22) | 3.8% | 3.8% |
Banks and lending
Demand for mortgages grew in Q2, building on Q1’s small increase, according to the latest Bank of England Credit Conditions Survey, of which a selection of results are shown in Figure 6. The availability of high-LTV products turned negative for the first time since Q2 2020, and the falling mortgage margins seen over recent quarters went into reverse.
Figure 6 – Secured lending availability and demand

Source: Bank of England Q2 2022 Credit Conditions Survey. Note: Negative net balance = decreasing availability / decreasing demand / wider margins