UK economic outlook Q3 2021

There was a stop-start nature to the economic recovery in Q3, with shortages of labour and materials taking over from pandemic restrictions as the main drag on growth.
Unemployment fell again and the number of paid employees finally returned to pre-pandemic levels. Lenders reported falling demand for mortgages, but off a very high base.
GDP and output
There was a mixed performance in Q3 as the economic recovery took a small step back in July (-0.1%) before returning to growth in August (+0.4%), according to the latest monthly estimates of GDP shown in Figure 1. This is a much slower pace of growth than earlier in the year and the economy remains smaller than it did at the end of 2019, by just 0.8%.
Figure 1 – monthly GDP estimates
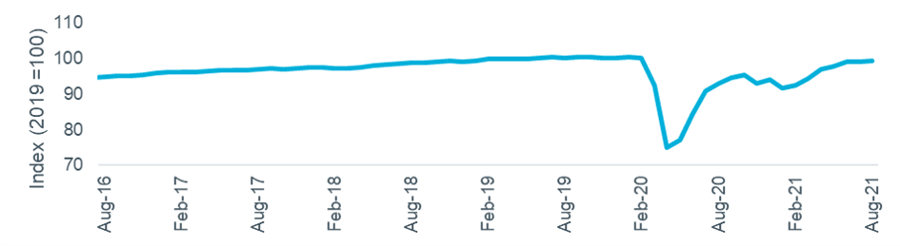
Source: ONS.
Sentiment towards the economy continues to be volatile, with consumer confidence and business optimism falling in Q3, although the latter remained in positive territory as shown in Figure 2. The latest data on household savings ratio (for Q2) showed a fall, but the current level is more than twice that of the pre-pandemic (2018-19 average) period.
Figure 2 – other economic indicators
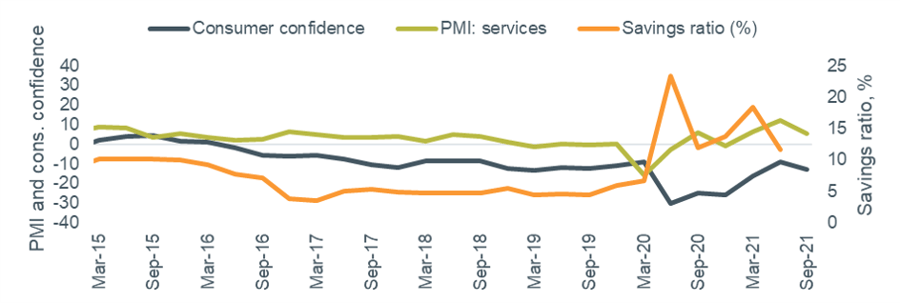
Source: GfK/NOP, IHS/Markit, ONS.
We saw last quarter that a consensus on 2021 UK GDP had been reached, with most recent forecasts in a narrow range. The latest Treasury Forecast Comparison report for October further confirms this, with the median and range very similar to July’s figures. This quarter we consider forecasts for 2022, with Figure 3 showing how views have changed over the past 18 months. Although there are fewer low forecasts being submitted, the median has been falling slightly in recent months, suggesting lower confidence in how the economy will continue to recover next year. The official central economic scenario from the OBR, published in October, is for growth of 6.0%.
Figure 3 – 2022 UK GDP forecasts over time
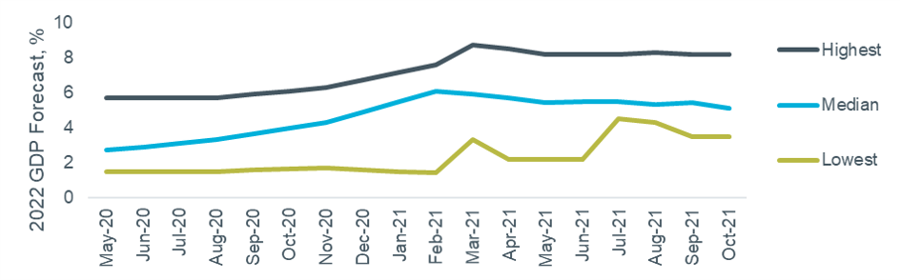
Source: HM Treasury (Month = date of report, data is the range of forecasts made in last three months).
Employment
Unemployment fell again in the three months to August, to 4.5% (from 4.8% in May). All three of the additional employment indicators recorded very positive annual growth in their latest figures, as shown in Figure 4.
Figure 4 – economic indicators: hours worked, paid employees and median pay
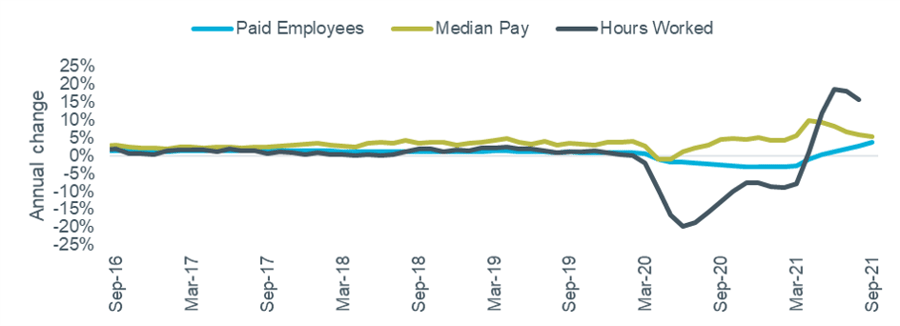
Source: ONS Labour Force Survey and HMRC PAYE Real Time Information.
While annual growth is clearly very strong, a comparison to the pre-pandemic situation may be more relevant. The table below shows both the current employment data and how it compares to the position at the end of 2019. The number of paid employees post-pandemic exceeded December 2019’s figure for the first time in September, but hours worked remain down despite the high rate of annual growth. Unemployment is also not fully recovered on this basis. Median pay is both growing strongly and significantly ahead of where it was pre-pandemic, but as previously noted this is in large part due to many lower paid roles being lost or furloughed rather than genuine pay growth on a like-for-like basis.
Table 1 – employment data
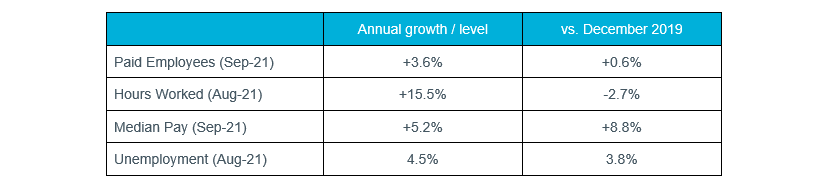
Source: ONS, HMRC.
The furlough (Coronavirus Job Retention) scheme closed at the end of September, but the latest data – available through August – showed over 1.3 million employments still on hold. This is just over half of the 2.4m jobs furloughed three months earlier and compares to a peak of 8.9m in May 2020. A summary of the data is shown in Figure 5.
Figure 5 – Coronavirus Job Retention Scheme data
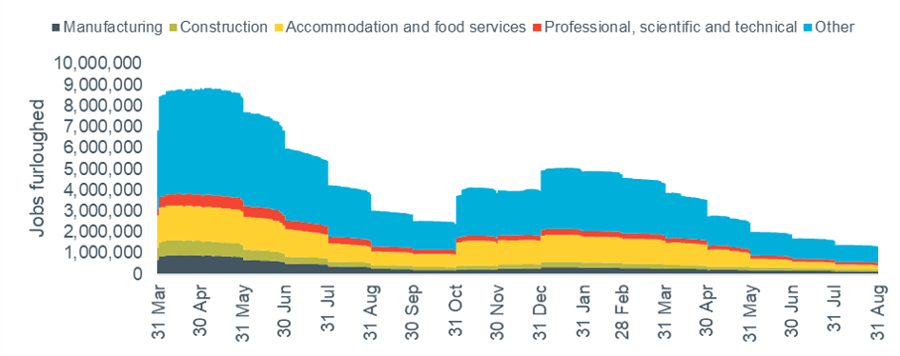
Source: HMRC.
Tourism-related industries continue to be the biggest users of the scheme: 44% of jobs in passenger air transport and 40% in travel agency and tour operator activities were furloughed at the end of August.
Banks and lending
Lenders reported a mixed picture for the mortgage market in Q3, according to the latest Bank of England Credit Conditions Survey, of which a selection of results are shown in Figure 6.
Figure 6 – Secured lending availability and demand
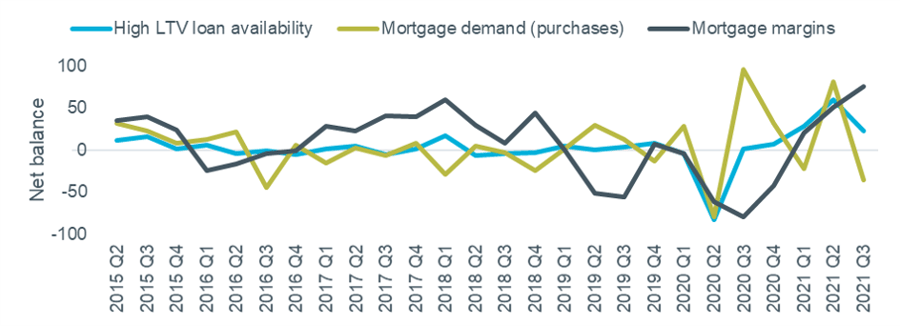
Source: Bank of England Q3 2021 Credit Conditions Survey. Note Negative net balance = decreasing availability / decreasing demand / wider margins.
Availability of high LTV products grew again but at a slower rate, demand for mortgaged purchases fell, and mortgage margins fell significantly.