UK economic outlook Q4 2021

The economy grew steadily in Q4 as it continued to recover from pandemic restrictions, with employment data also looking good.
However, inflation reached a 30 year high in December and the expectation of further interest rate rises could slow down housing market demand.
GDP and output
A major milestone was reached in Q4 as the economy finally returned to its pre-pandemic size, according to the November GDP estimate. Recent GDP growth trends are shown in Figure 1.
Figure 1 – monthly GDP estimates
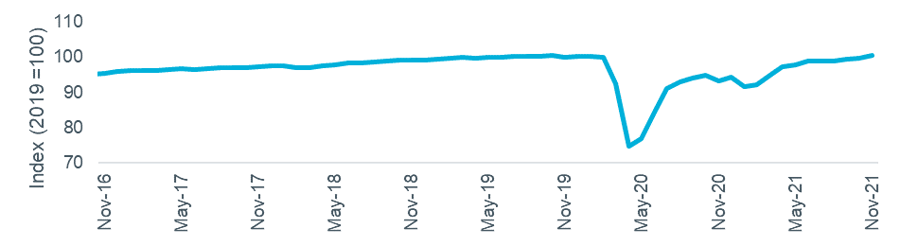
Source: ONS
Potentially of more importance to households than GDP, inflation has increased rapidly over the past ~8 months and moved well above its 2% target (CPI was 5.4% in December). Some of this rise is due to shortages of labour and goods, which may be a short-term issue, but the Bank of England has already raised the base rate twice in two months (to 0.25% in December then to 0.5% in February). The Bank increased its inflation forecast and said it would continue to raise rates this year and next. This could impact on affordability and dampen demand for house buying.
Figure 2 – Inflation (CPI)
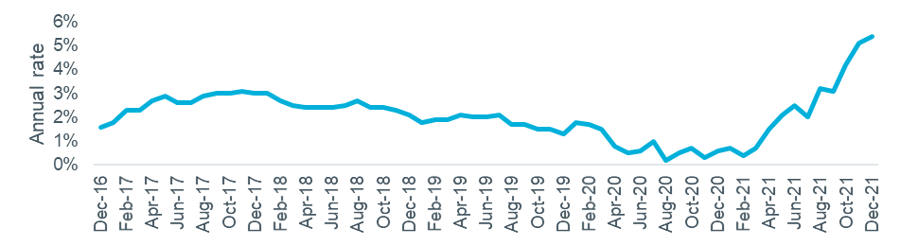
Source: ONS
Other indicators suggest that confidence in the economy is fragile, with consumer confidence and services PMI measures in Q4 both weaker than the previous quarter’s figures. However, the fall in savings ratio (for Q3) does indicate more consumer spending and therefore more confidence. Figure 3 shows the latest data.
Figure 3 – Other economic indicators
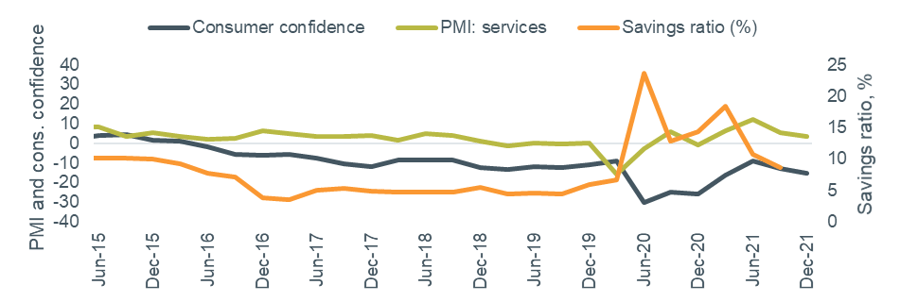
Source: GfK/NOP, IHS/Markit, ONS
The recent UK GDP forecasts for 2022 show a very narrow range of expectations, suggesting economists see the volatility of the pandemic period reducing. The latest data on this measure from the Treasury Forecast Comparison reports up to January is shown in Figure 4. The official central economic scenario from the OBR, published in October, is for growth of 6.0%.
Figure 4 – 2022 UK GDP forecasts over time
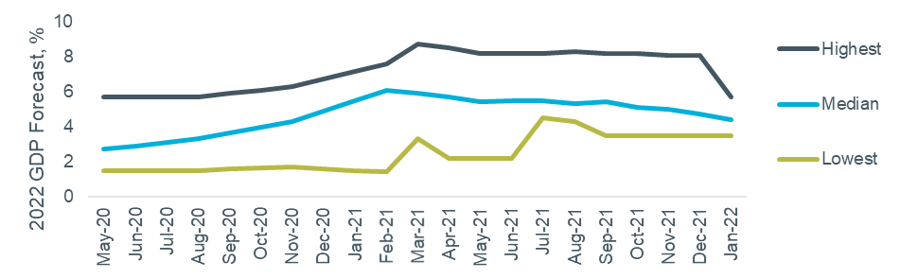
Source: HM Treasury (Month = date of report, data is the range of forecasts made in last three months)
Employment
Unemployment fell again in the three months to November, to 4.1% (from 4.5% in August). All three of the additional employment indicators recorded annual growth of around 5% in their latest figures, as shown in Figure 5. There were over 400,000 more paid employees now in work compared to the pre-pandemic peak in February 2020, although this is more than offset by a fall of around 1m self-employed workers over the same period.
Figure 5 – Economic indicators: Hours worked, paid employees and median pay
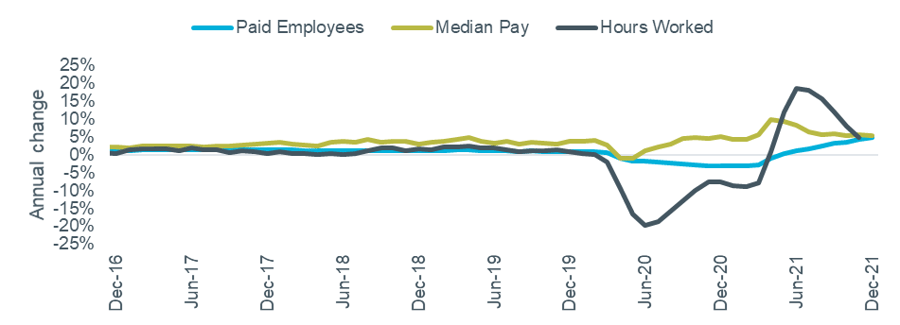
Source: ONS Labour Force Survey and HMRC PAYE Real Time Information
Annual growth of the employment measures remains high but the position relative to pre-pandemic is also a useful comparison, as shown in the table below. Hours worked remain 3% lower than their December 2019 level, whereas median pay is more than 10% higher. As previously noted this is in large part due to many lower paid roles being lost or furloughed rather than genuine pay growth on a like-for-like basis.
Table 1 – Employment data
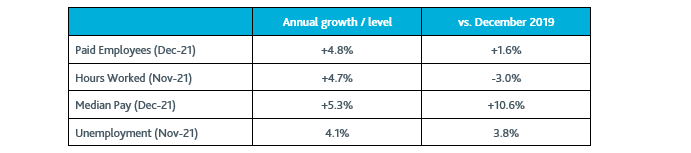
Source: ONS, HMRC
The final data covering the furlough (Coronavirus Job Retention) scheme up to its September end date is now available. Over 1.1m employments were on hold at the end date, but this does not appear to have had a significant effect on the overall unemployment rate. A summary of the data is shown in Figure 6.
Figure 6 – Coronavirus Job Retention Scheme data
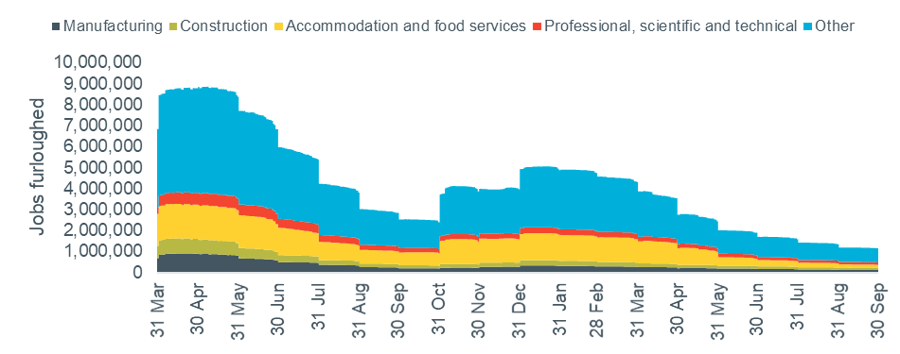
Source: HMRC
Tourism-related industries were the biggest users of the scheme when it closed: 38% of jobs in passenger air transport and 35% in travel agency and tour operator activities were furloughed at the end of September.
Banks and Lending
Mortgage demand fell slightly in Q4, with lenders reporting better availability of high-LTV products and strongly falling margins, according to the latest Bank of England Credit Conditions Survey, of which a selection of results are shown in Figure 7.
Figure 7 – Secured lending availability and demand

Source: Bank of England Q4 2021 Credit Conditions Survey. Note Negative net balance = decreasing availability / decreasing demand / wider margins.