UK sales review Q3 2021

The high demand and relatively low supply environment persisted in Q3, meaning more house price growth and continuing high levels of activity as buyers competed over available homes. Annual house price growth at UK level remained over 10% and transactions jumped again in September as sales were brought forward to beat the end of the stamp duty holiday.
Despite no change of stamp duty savings, demand appears to be holding up well, suggesting that other factors remain in play. Changes to commuting patterns (including increased working from home) now being confirmed as a longer-term option by some employers is likely to continue to be an important driver.
Monthly data
The latest monthly figures, displayed in Figure 1, show both activity and price growth weakening compared to recent peaks, but still above longer-term trends. There were 74,000 mortgage approvals in August (vs. a recent peak of 104k in November), and Nationwide reported monthly price growth of 0.1% in September (vs. 2.3% in April).
Figure 1 – UK house prices and mortgage approvals, monthly
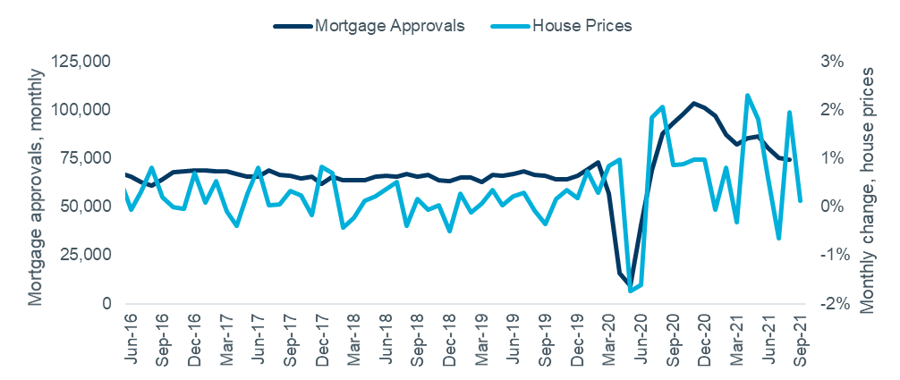
Source: Nationwide HPI, Bank of England. Note both seasonally adjusted.
Transaction trends
September saw the final stamp duty holiday-related spike in transactions, with HMRC recording over 160,000 completed sales in the month, taking the annual total over 1.5m for the first time since early 2008. The current level of activity is around 30% over the 2017-19 average.
The ONS index only covers the period to June, and the latest months are incomplete due to the lag in recording completions, but it is also starting to reflect higher levels of sales. The data for March now shows 122,000 transactions, updated from 98,000 when originally published, showing the scale of potential revisions.
Agent sentiment suggests that further significant growth in transaction numbers is unlikely in the short term. The RICS Housing Market Survey for September reported a net balance of -15 for ‘Agreed Sales’, down from -1 in June. The further forward-looking ‘Sales Expectations’ measure is slightly more positive at +11, compared to -3 in June.
In the past these results, when ‘lagged’ by nine months, have been a good predictor of short-term trends in activity. However, the market has been responding more quickly through the pandemic, and with more volatility likely this year it could be many months before a clear new trend emerges. Figure 2 shows the two survey metrics plotted against the two measures of actual transaction levels.
Figure 2 – actual transaction levels vs. RICS sales metrics
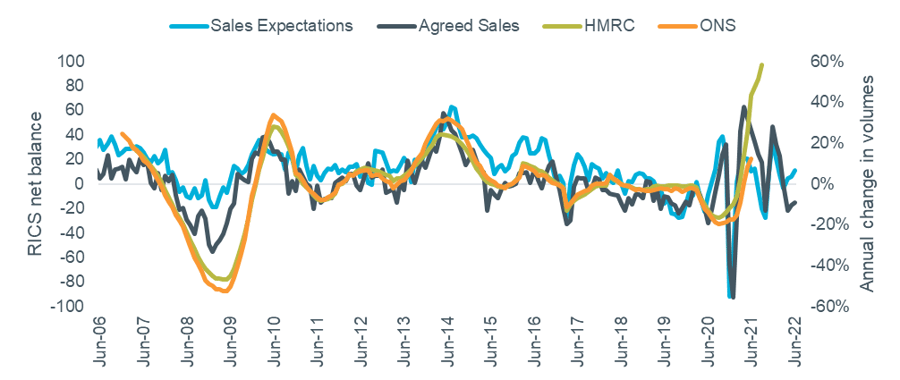
Source: RICS Housing Market Survey (Sep 2021), HMRC, ONS UK HPI. Note RICS figures lagged 9 months. RICS and HMRC figures seasonally adjusted.
Rightmove’s September index report noted that buyer demand remained double its pre-pandemic level, but that the level of new sales instructions was gradually increasing and could lead to a “better-balanced autumn market”. Average time to sell has stabilised, at 37 days in September compared to 38 in June.
Zoopla’s September index noted ‘no sign of any cliff edge in demand for homes, which continues to run at 25-30% above the 5-year average’. Actual sales agreed are 16% up compared with that same baseline. Looking ahead, they suggest that ‘the increased activity due to the pandemic has further to run – albeit at a less frenetic pace’.
House prices
Annual house price growth remained in double digits at national level in Q3 according to both the Nationwide (September, +10.0%) and ONS (August, +10.6%) indices, although these figures represent a slightly slower pace of growth compared to that recorded in Q2.
The index results are shown in Figure 3, alongside RICS sentiment survey results. The surveyors’ net balance of opinion for ‘Achieved Prices’ fell back to +68 in September after reaching a peak in Q2 (+82 in May). ‘Price Expectations’ also fell back from recent highs to +21 in September (vs. a peak figure of +47 in April). These results indicate that there are some signs of the market cooling and that, while outright price falls are not expected, the agents surveyed do anticipate this trend to continue.
Figure 3 – actual value changes vs. RICS price indicators
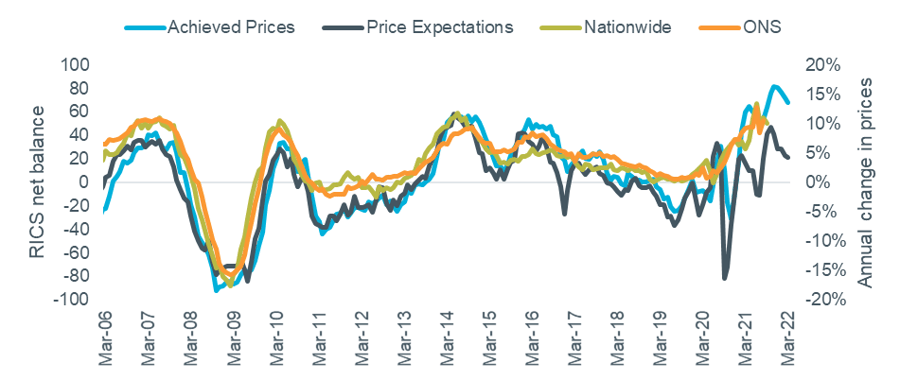
Source: RICS Housing Market Survey (Sep 2021), Nationwide HPI, ONS UK HPI. Note RICS data lagged 6 months.
Rightmove reported further growth in national asking prices in Q3, with their September index setting a new record high of over £338,000, which represents annual growth of 5.8%. While demand remains strong their report notes that falling levels of stock for sale has been a significant factor in supporting prices. However, this trend could be set to ease – average stock per agent in September was 49 properties, unchanged from August.
Zoopla’s September index recorded UK annual house price growth of 6.6%. They expect further growth in 2022 as long as demand continues to outstrip supply; the latest update of these metrics is shown in the table below. Note that Zoopla continue to report lower growth than other indices due to weighting the average by the stock of homes rather than the homes that are actually transacting. With houses much more popular than flats at the moment and seeing higher price growth, the transaction-weighted indices will report larger rises.
Table 1 – Zoopla Market Metrics, week ending 18 October vs 5-year average

Source: Zoopla September Index.
Outlook
The headline figures for transactions and price growth in Q3 looked strong but there are some signs that momentum in the housing market is slowing. The potential for higher inflation to drive increases in mortgage rates and general living costs could limit scope for further price growth. A further downside risk is the economic recovery stalling, either due to a return to pandemic-related restrictions or a worsening in the supply chain issues that have emerged in recent months.
Note: RICS data lagged 6 months