Wider South East Q3 2021

High levels of house price growth were seen in both the sales and rental markets of the wider South East in Q3, continuing the trend seen throughout 2021 so far.
At district level there are local hotspots in coastal areas and lower value markets.
South East sales market
The wider South East saw house price growth remain strong in Q3, although values rose slightly more slowly than the national rate of 10.3%. Table 1 shows the latest regional index results, with Figure 1 showing the trend back to 2006.
Table 1 – Regional house prices, Q3 2021
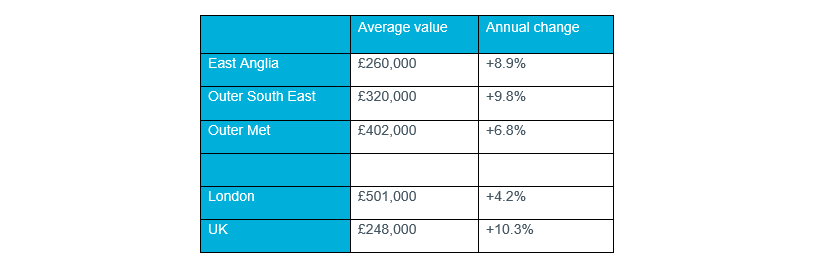
Source: Nationwide House Price Index (values rounded to £1000).
Figure 1 – House price growth: wider SE, London and national
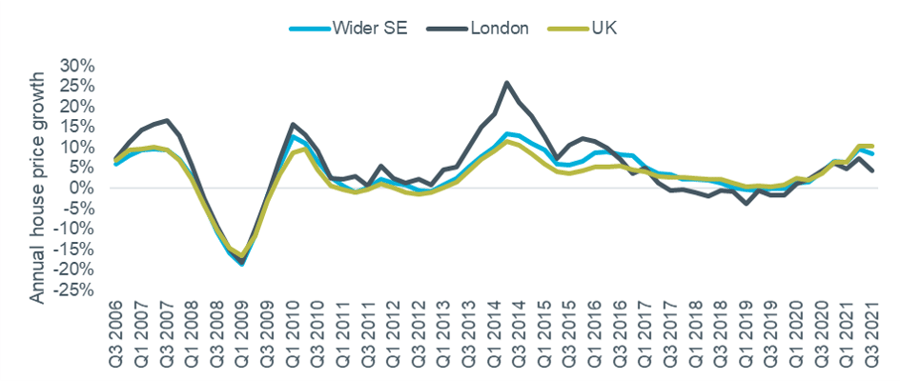
Source: Nationwide (Wider SE represented by average of ‘Outer Met’, ‘Outer SE’ and ‘East Anglia’ areas). Note Quarterly regional series uses different UK figure to main monthly index.
The measure of London values relative to the wider South East saw its largest ever quarterly fall in Q3, to 1.53, compared to 1.59 in Q2. This is the lowest level since Q2 2013 and continues a falling trend since the peak of 1.75 in Q4 2015. The full data series is shown in Figure 2.
Figure 2 – ratio of London to wider South East values
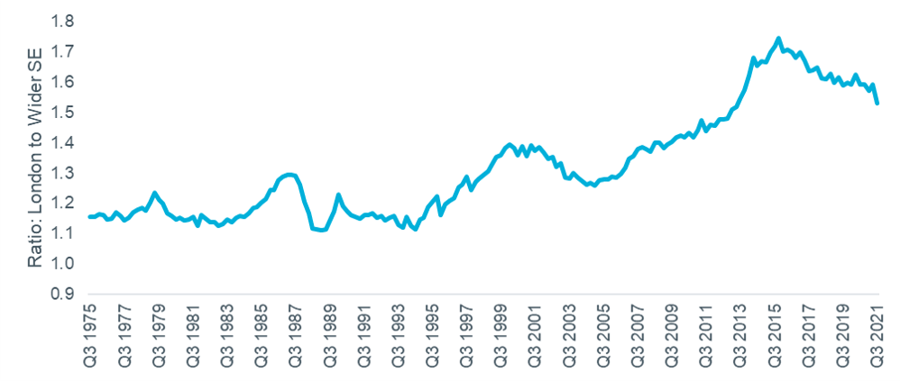
Source: Nationwide. (Wider SE represented by average of ‘Outer Met’, ‘Outer SE’ and ‘East Anglia’ areas).
District-level data shows how house price growth is distributed within the wider South East. The pattern from the August house price index data is similar to three months ago, with the highest rates of growth seen outside the traditional commuter belt, in coastal locations including Hastings, Rother, and North Norfolk.
Figure 3 – annual house price growth at local authority level, August 2021
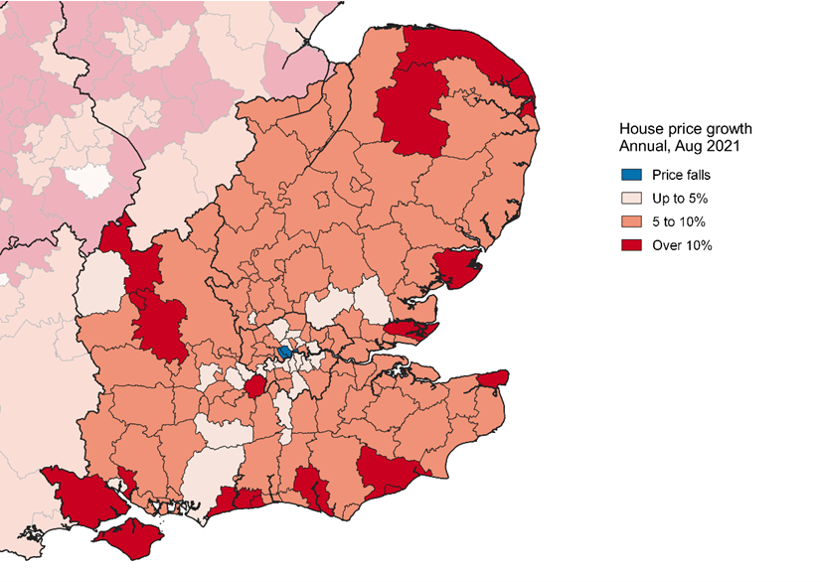
Source: Land Registry, 6-month smoothed data.
South East rental market
Figure 4 shows rental growth data at regional and national level from the ONS. This is based on all rents paid so is slow to respond to changes in market conditions. Rents in the East continue to be the fastest growing on this measure, with annual growth of 2.3% in September, with the South East at 1.7% also ahead of the national average (1.3%). By contrast, rents in London fell by 0.3%.
Figure 4 – rental growth: Southern regions, London and National
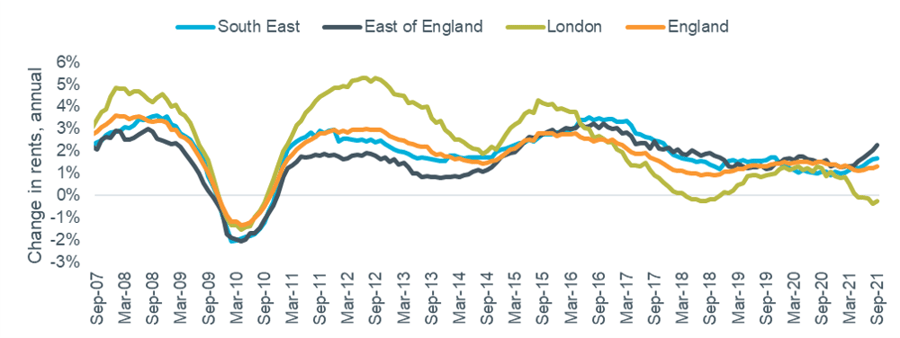
Source: ONS Index of Private Housing Rental Prices.
Analysis based on new lettings showed higher levels of inflation than the ONS index. Annual rental growth in the East and South East remained strong but moderated slightly compared to the previous quarter according to Homelet’s September index, but Rightmove’s Q3 index reported an increase in the pace of growth, as summarised in the table below.
Table 2 – Regional rental data, Q3 2021
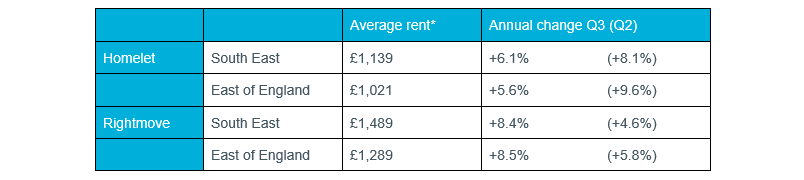
Source: Homelet Index (actual achieved rents), Rightmove Rental Trends Tracker (asking rents).