Industrial market update Q2 2023

Average industrial property yields which softened sharply last year remained largely unchanged in Q1 2023, as the market absorbed the new economic landscape in the UK.
Even with the repricing of the last year, yields are now around the same level as they were at the start of the pandemic. In the 12 months to the end of March, average capital values for industrial were down 24%, according to MSCI data.

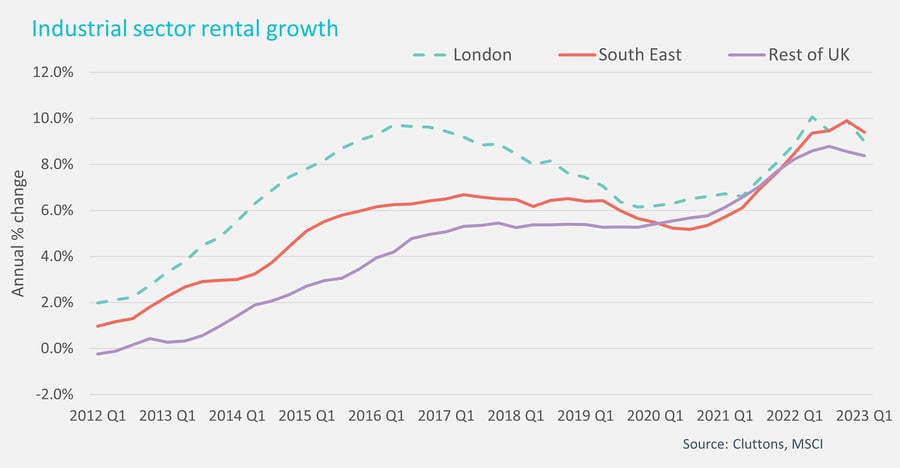
Even so, rents continue to rise, with an average increase of 8.6% in the 12 months to the end of Q1. Some regional markets are registering double digit rental growth, including Tees Valley and Durham, at 13.3% growth, and Manchester with a 12% average rise across light industrial and logistics.
The rise in rents can partly be attributed to continued tight supply in the market with vacancy rates broadly unchanged over the last year – averaging 3.6% for the UK. Constructions levels have risen, and although take-up has slowed, particularly due to more limited requirements for large e-commerce companies such as Amazon, it is still in line with longer-term trends, resulting in positive net absorption in Q1.
There has been a significant rise in the number of schemes under construction in the last few years and a record 78.5 million square feet is currently in the pipeline – with around a quarter being speculative. As these schemes are released the vacancy rate may start to rise, which would put some pressure on rental growth – although it will likely continue to be positive, albeit at a lower rate than current levels. Buildings that are built to a high specification, and especially those that meet the top ESG requirements will still attract a premium. Higher rateable values and higher energy costs will also have an impact on rental growth.
In London, market conditions have been weaker, with lower demand levels pushing vacancy rates to a 5-year high of 4.6%, and putting some downward pressure on rental growth in the capital. The pressure on demand came as retailers moved their distribution centres from outer London to other regional hubs, such as Milton Keynes. However, increased appetite for last-mile delivery units could be behind another rise in demand in the capital if online retailers increasingly focus on the speed of deliveries.
Investment activity remained muted in Q1 after a very slow market in H2 2022 amid the political volatility and economic uncertainty. However, even with such a pronounced drop in activity in H2, the total levels of investment for the final six months of the year were broadly in line with longer-term trends, a reflection of the strength of the industrial sector over the last few years. There are signs that activity will start to rise, with large deals in the pipeline. The re-pricing is engendering increased interest in assets, with some examining whether the downwards movement was too extreme for current market conditions.

As such there may be some evidence in the coming months of prices hardening, which would, in turn, create further activity as those in ‘wait-and-see’ mode start to re-enter the fray.
| **Industrial Q1 2023 unless otherwise stated | **UK | **London & South East |
| **Distribution, multi-let estates and specialised industrial | **Current quarter (last quarter / 5yr ave) | **Current quarter (last quarter / 5yr ave) |
| Occupier | ||
| Availability rate (%) | 5.2% (5.2% / 5.6%) | 6.06% (6.2%/5.5%) |
| Vacancy rate % | 3.6% (3.4% / 3.2%) | 3.9% (3.7%/3.1%) |
| Rental growth (12-month growth rate) | 8.6% (8.9% / 6.3%) | 9.3% (9.9% / 6.6%) |
| Quarterly take up (sq ft) | 13.3m sq ft (16.1m / 24.6m) | 2.7m sq ft (3.2m / 5.7m) |
| Supply | ||
| Completions (net delivered sqft) | 11.5m sq ft (11.2m / 11m) | 2.1m sq ft (1.7m /2.2m) |
| Total under construction (sqft) | 75.0m sq ft (67.1m / 53m) | 17.4m sq ft (15.1m /9.7m) |
| Investment | ||
| Quarterly sales volume £m | £1,597m (£1,960m / £2,833m) | £594m (£712m/ £1,050m) |
| Average yield | 4.7% (4.5% / 4.3%) | 4.3% (4.2% / 3.9%) * |
| Prime yield (rack rented) May 2023 (Q4 2022) | 5%- 5.25% (4.75%-5%) Prime regional | 4.5%-4.75% (4.25-4.50%) Within M25 |
Industrial: key investment transactions
| **Property Address | **Town /City | **Date | **Building size (sq ft) | **Sale Price (£m) | **Net Initial Yield | **Buyer |
| Perimeter Road | Liverpool | Q1 2023 | 585,200 | £57.2m | 4.6% | Brookfield |
| Pilot Way | Coventry | Q1 2023 | 881,000 | £130m | – | Goldman Sachs |
| Lamplight Way | Manchester | Q1 2023 | 53,756 | £6.6m | 4.7% | Cabot Properties |
| Dorando Way | Birmingham | Q1 2023 | 152,000 | £18.1m | 5.1% | Blackstone |
The information provided in this report is the sole property of Cluttons LLP and provides basic information and not legal advice. It must not be copied, reproduced or transmitted in any form or by any means, either in whole or in part, without the prior written consent of Cluttons LLP. The information contained in this report has been obtained from sources generally regarded to be reliable. However, no representation is made, or warranty given, in respect of the accuracy of this information. Cluttons LLP does not accept any liability in negligence or otherwise for any loss or damage suffered by any party resulting from reliance on this publication.

Richard Moss
Partner, valuation & advisory – head of commercial UK funds
Head office
T +44 (0) 20 7647 7226
Richard Moss
Partner, valuation & advisory – head of commercial UK funds
Head office
T +44 (0) 20 7647 7226